

The technical analysis of week 41 delves into the sharp market reaction, which briefly pushed bitcoin above the psychological threshold of $30 000. Additionally, we will explore the recent market analyses by Larry Fink and Nikolaos Panigirtzoglou. We will also examine CryptoQuant’s trillion-dollar market capitalization model and why bitcoin is heavily diverging from other cryptocurrencies.
The weekly price development of the crypto market has turned notably positive, with bitcoin rising by 4.3 percent. At the same time, bitcoin’s spot price has, for the first time since August, successfully maintained a position above the 200-day moving average.
The rally, fueled by ETF speculations, triggered a strong spot price reaction, causing the leading cryptocurrency to briefly surpass $30 000. Speculation was influenced in part by erroneous reporting from the Cointelegraph media. Later, BlackRock’s Larry Fink commented that the rally was due to a “flight to quality.”
“I think the rally today is about the flight to quality.” – Larry Fink, BlackRock
JPMorgan’s expert, Nikolaos Panigirtzoglou, commented that the macroeconomic environment is recovering while the supply reductions of the dollar have been smaller than expected. According to him, the current macro environment supports risk asset classes.
Previous technical analyses have assessed the correlation between bitcoin and the M2 money aggregate, with cryptocurrency bull cycles coinciding with periods of quantitative easing. Conversely, quantitative tightening has been detrimental to digital asset classes. In particular, the NFT market, which has experienced a decline in trading volume, has suffered from the end of the “cheap dollar” era and high-interest rates.
“There is little doubt that this more benign than previously feared US money supply or liquidity backdrop supported risk assets over the past four months.” – Nikolaos Panigirtzoglou, JPMorgan
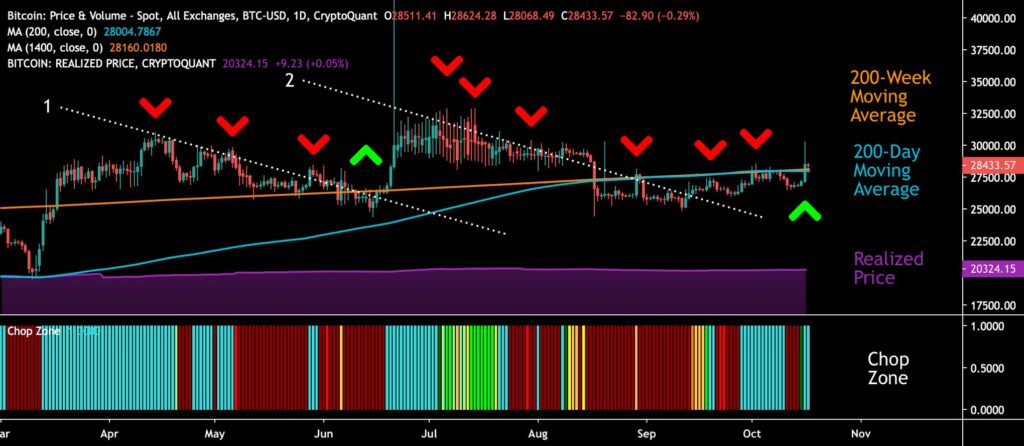
From a purely technical standpoint, bitcoin’s strong bullish momentum has propelled it above both the 200-day (turquoise) and 200-week (orange) moving averages. These two moving averages are now forming support levels for bitcoin. Two descending trendlines (1-2, white) defined the spot market from spring to autumn, but BTCUSD is now gaining momentum from the halving cycle. The last quarter of the year may simultaneously serve as a technical turning point towards higher valuation levels in spring 2024.
Sources: Timo Oinonen, CryptoQuant
The realized price (violet) continues to act as a lower support level for bitcoin, forming a clear divergence from the spot price. The realized price also serves as a market watershed as it represents the average price of all bitcoin purchases, indicating that the average investor is in profit.
Last week, we examined the negative premium of Grayscale’s GBTC fund, which has reached its highest level since 2021. The premium, which previously sunk to as low as -49 percent, can be seen as a leading indicator in the market, anticipating a later spot price rise. At the same time, investors’ “discount trading” time window is closing with the vanishing premium.
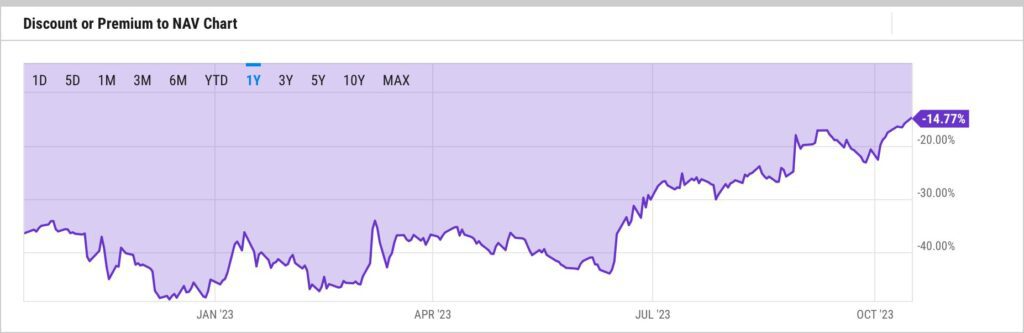
Source: YCharts
Material Indicators’ classic heat map reflects broken resistance levels amid the buying pressure. On the other hand, support levels also look relatively weak. Cumulative volume delta (CVD) shows demand increasing in nearly all groups, with whale-level buyers standing out from the crowd.
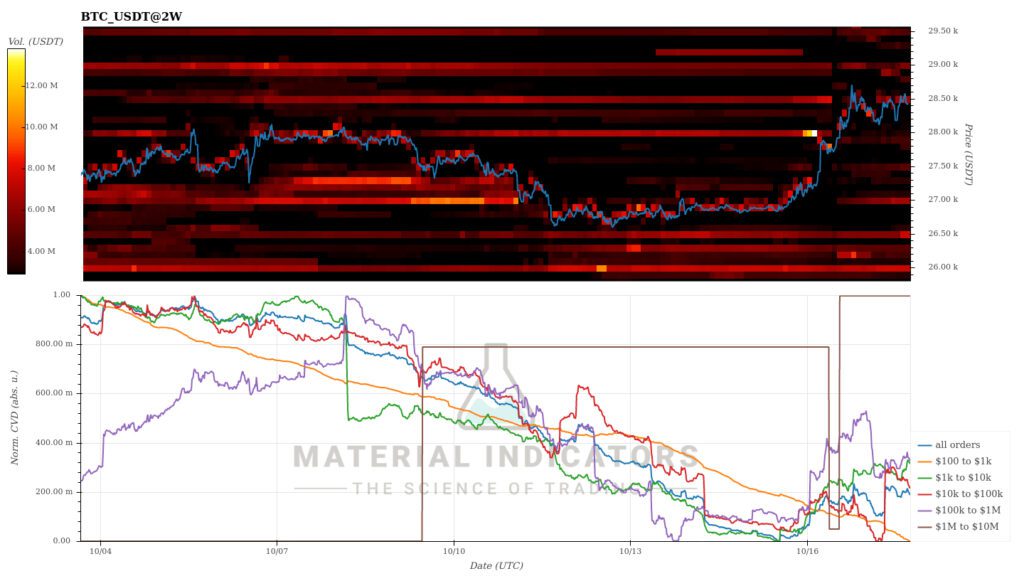
Source: Material Indicators
The weekly level focus is now clearly on bitcoin at the expense of other cryptocurrencies, as the leading digital currency strengthens by six percent. The playing field for smaller currencies appears relatively turbulent, with the native UNI token of the decentralized Uniswap exchange weakening by nearly five percent. Uniswap’s negative market reaction is believed to be related to Uniswap Labs’ new 0,15 percent fee model, which has garnered criticism.
In addition to the “digital gold” bitcoin, physical gold, which mimics its scarcity characteristics, has also risen by over four percent in the week. Both of these safe-haven assets may be driven by the realization of geopolitical risks in the Middle East.
7-Day Price Performance
Cardano (ADA): -1,1%
Rising Bitcoin Diverges from Other Currencies
Buoyed by the early week rally, bitcoin has now gained more than 71 percent this year as the YTD trend returns to the uptrend. At the same time, bitcoin is running away on its own, creating a deepening divergence with other currencies listed on Coinmotion.
Classification speculations of July temporarily boosted XRP and Stellar to 140 and 120 percent YTD figures, but the duo’s momentum has since subsided. However, the US Securities and Exchange Commission’s SEC commodity and security ratings continue to divide the market, with commodity-rated bitcoin, Ethereum, and XRP outperforming others.
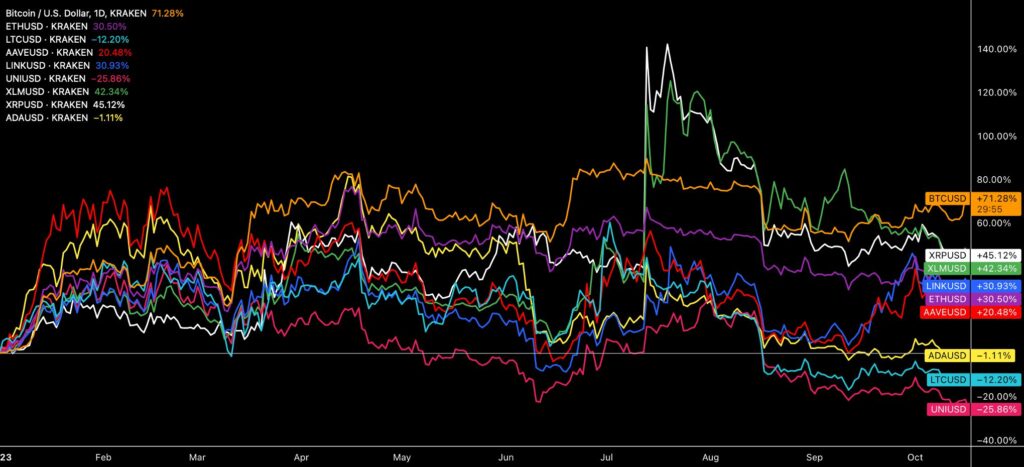
Source: TradingView
On the other hand, the divergence between bitcoin and Ethereum is now clearly increasing. Compared to the beginning of the year, bitcoin dominance has grown by 27 percent, while the ETHBTC pair has weakened by -28 percent. As the embedded chart shows, Ethereum’s price performance has significantly declined in October relative to the leading cryptocurrency.
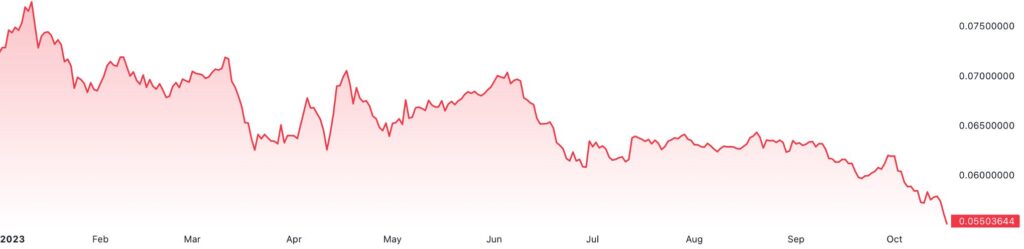
Source: TradingView
The weakening momentum of Ethereum is also illustrated by the structure of CME futures, where traders are going long on bitcoin and short on Ethereum simultaneously.
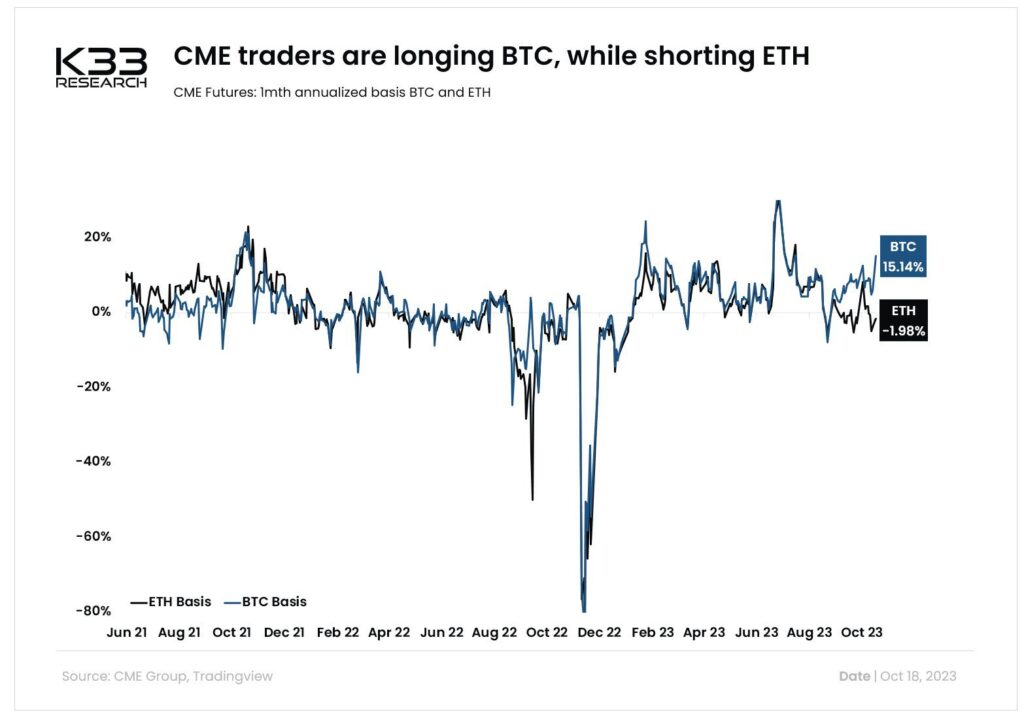
Source: K33 Research
Can Bitcoin’s Market Cap Return to Trillions?
With the anticipated spot ETF and the approaching 2024 halving, it’s a good time to delve into bitcoin’s fresh market cap projections. The recent report of CryptoQuant estimates that the ETF alone could increase Bitcoin’s market cap by one trillion dollars. CryptoQuant supports this thesis with the sharp growth of institutional demand, while the ETF makes it easier to gain bitcoin exposure.
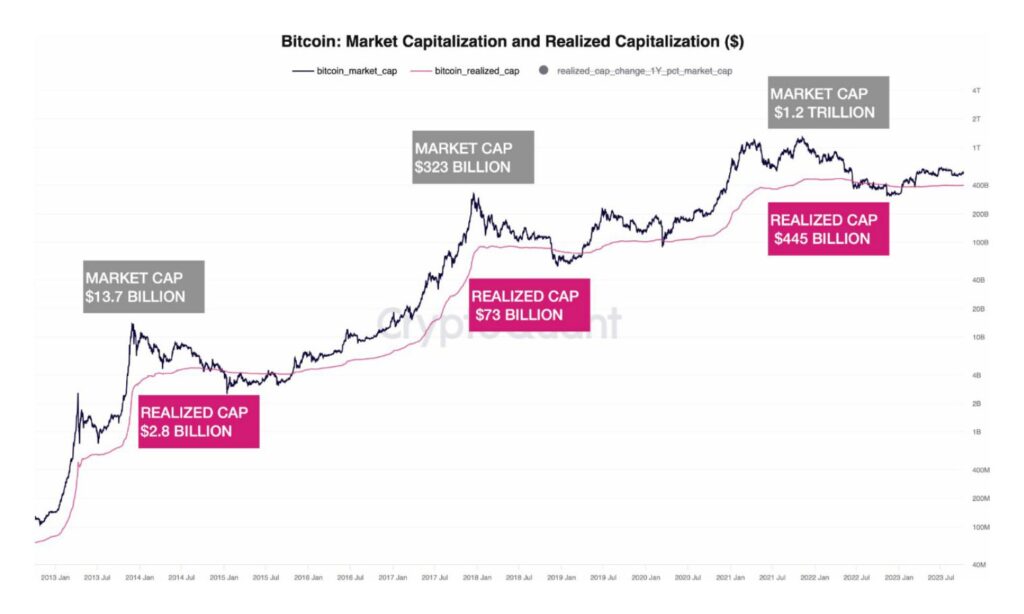
Source: CryptoQuant
According to CryptoQuant, the market is expected to see an inflow of up to $155 billion in the aftermath of the ETF decision. This figure is derived from the $ 15.6 trillion in assets under management (AUM) by companies that have listed ETF applications, with approximately 1% ($155 billion) assumed to flow into the asset class. This inflow could represent up to a third of bitcoin’s current market cap.
CryptoQuant’s model emphasizes bitcoin’s realized market cap (violet), which has historically increased as new money flows into the market. Following the realized price, the realized market cap reflects the market cap of all bitcoin units at the time of their purchase. The company describes the relationship between bitcoin’s market cap and realized cap as elasticity, with a growth factor that has ranged between 3 and 6 in previous cycles.
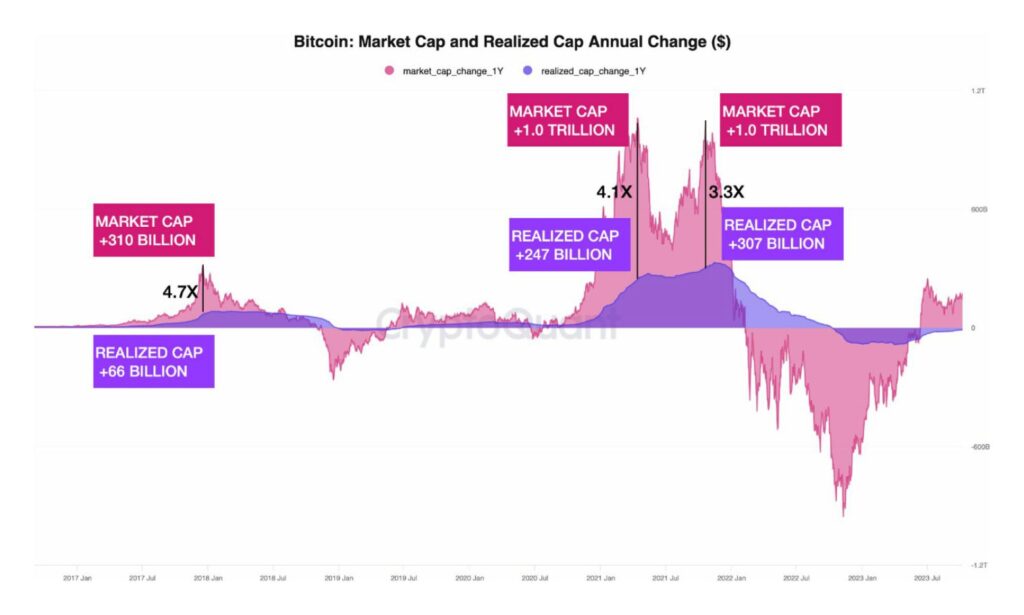
Source: CryptoQuant
What Are We Following Right Now?
Europe’s leading Bitcoin event, the Lugano Plan B Forum, is taking place in the Ticino canton of Switzerland this week. It offers a comprehensive repertoire of speakers and topics, ranging from anarcho-capitalism to institutions. Lugano, dubbed the “Crypto Capital,” is at the forefront of the blockchain industry, as it has established the infrastructure for using bitcoin, Tether, and the city’s native LVGA token in all transactions.
The decentralized exchange operator Uniswap Labs has made a controversial decision to implement a new 0.15 percent interface fee. The decision appears to be a response to the new MiCA regulation, as Uniswap aims to operate under the CASP license.
The decision has received a mixed reception within the community, with some interpreting Uniswap Labs as bypassing the UNI token holders in their decision-making process. At the same time, the decision raises questions about the true level of decentralization of Uniswap. Be that as it may, the regulation is tightening, and decentralized finance operators continuing to operate must adapt to the new legislation.
From a price development perspective, Uniswap represents the year-to-date low among tokens listed on Coinmotion, declining by a substantial -26 percent since the beginning of the year.
A short documentary about Argentina’s inflation crisis and the devaluation of its national currency. The country is infamous for its unsustainable debt levels and political instability. However, the country’s direction may be shifting, with presidential candidate Javier Milei gaining strength in the latest polls. Libertarian Milei has previously made positive comments regarding bitcoin while opposing the role of central banks. His goals also include reducing the state’s dominant position in society.

Stay in the loop of the latest crypto events
- Dive into Cardano (ADA): A newcomer’s comprehensive guide
- Security measures to safeguard your cryptocurrencies: Lesson #10
- Searching for Uptober
- 200 Days Until the Halving: Bitcoin’s Next Chapter
- Risk management strategies to minimize losses: Lesson #9
- Identify trends, buy and sell signals with technical indicators: Lesson #7
- How to send money home via crypto: Remittance made easy
- Aave: The DeFi Powerhouse Changing the Crypto Landscape

The views, thoughts, and opinions expressed in the text belong to the author and not necessarily to the author’s employer, organization, committee, or other group or individual.