

The technical analysis of week 42 evaluates the causes and consequences of bitcoin’s October storm. At the same time, we delve into the price discovery cycle of the leading cryptocurrency and the liquidity gap. In addition to bitcoin’s more than 100% rise since the beginning of the year, MSTR stock is leading with an almost 200% upward trajectory.
The cryptocurrency market’s bullish cycle escalated this week, with bitcoin strengthening by over 20% against the dollar. Market sentiment is shifting from cautious to clearly positive as investors try to price in the expected impact of the spot ETF and the 2024 halving event.
According to the renowned Delphi Digital research firm, the market is moving towards an inflection point that will define the 2024 halving cycle. Delphi Digital’s Kevin Kelly also mentions that quantitative tightening (QT) by central banks is at its culmination, with a new QE cycle on the horizon. Experts like Raoul Pal have previously argued that the M2 money supply correlates with bitcoin’s spot price. It is clear that the return of QE would support bitcoin and other high-beta assets.
“We’re getting closer to the point where the rubber will meet the road. We’ve written plenty on the bull case for bitcoin and crypto, and that hasn’t changed. Crypto prices are still tracking our expected cycle trend, and the next big test is whether we see another period of consolidation – or if the breakout we’ve been waiting for is finally near. The End Game thesis is starting to play out in real time, even if we have to wade through some fire to get there.” – Kevin Kelly, Delphi Digital
Delphi’s technical model reflects the 2017-2020 cycle in relation to bitcoin’s current price, suggesting that the cryptocurrency is approaching a breakout situation. The spring COVID crash of 2020 hints at the possibility of a temporary price collapse, although it is unlikely that the current cycle will mimic the previous one in detail.
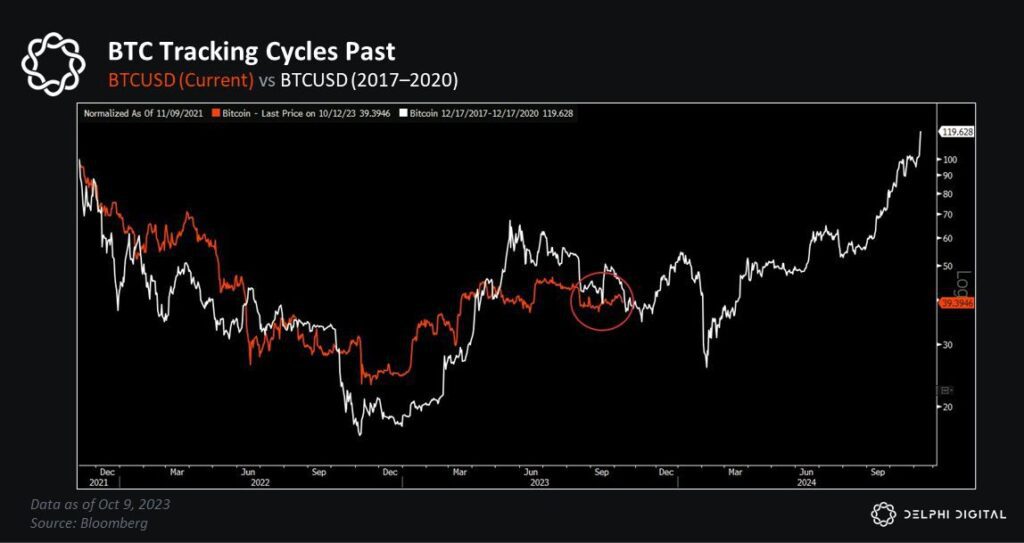
Source: Delphi Digital
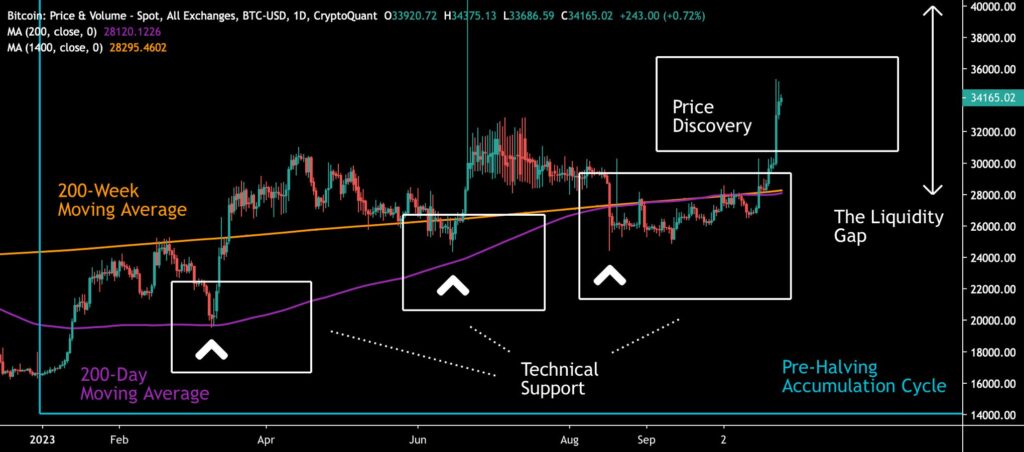
From a purely technical perspective, bitcoin transitioned into an entirely new price discovery cycle earlier this week, filling a liquidity gap extending to approximately $40 000. Supported by ETF speculations and the spring 2024 halving event, bitcoin is evidently undervalued, with the halving cycle not yet priced in.
What then caused the parabolic price surge between Monday and Tuesday? According to Michael Novogratz in a Bloomberg article, the spot ETF decision is expected to materialize before the year-end, as smart money is currently accumulating bitcoin. The spot ETF is likely to drive the price higher initially, with the halving event occurring within the next 12 months. Together these two events with their compounding effects, offer significant momentum for the leading cryptocurrency.
Sources: Timo Oinonen, CryptoQuant
Material Indicators’ classical heat map reflects bitcoin’s exceptional price surge breaking through resistance levels. Bitcoin’s price is aiming to breach the $35 000 resistance level, which has remained robust so far. Cumulative volume delta (CVD) indicates an increase in demand, especially within the segment of larger players.
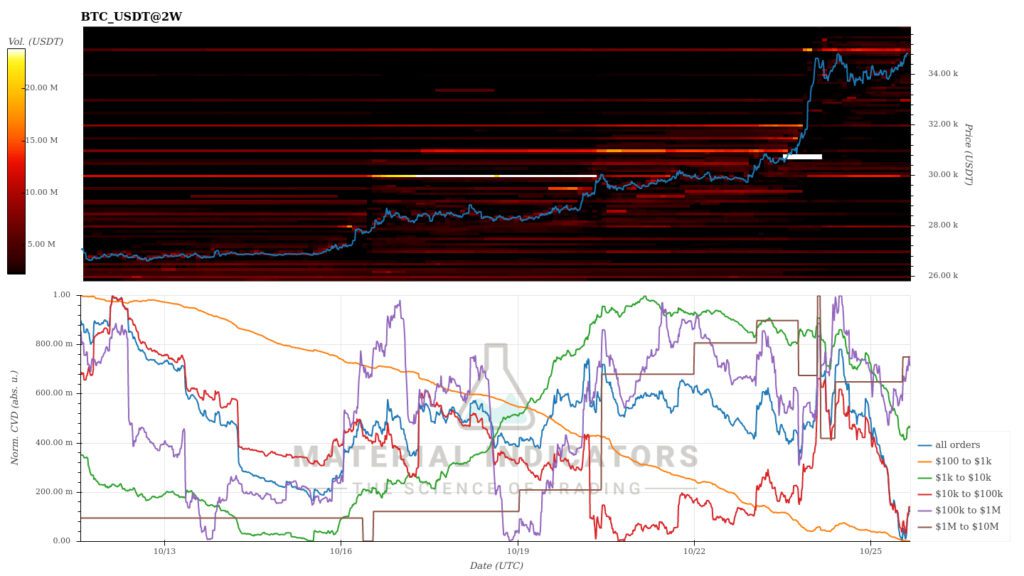
Source: Material Indicators
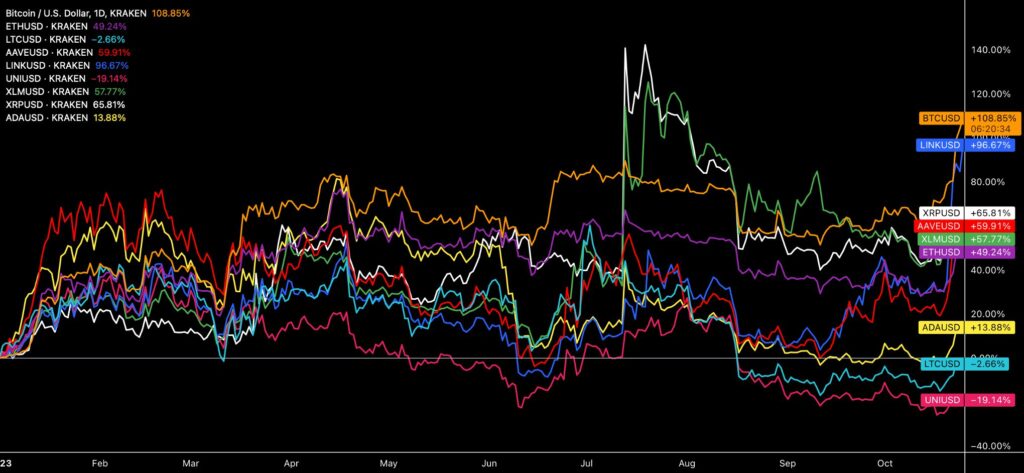
The price discovery cycle of bitcoin is now lifting the entire market in correlation. Significant weekly gainers include bitcoin, Ethereum, Chainlink (44.7%), and Aave (22.6%). Meanwhile, the S&P 500’s over 2% decline signals the decoupling between cryptocurrencies and the stock market.
7-Day Price Performance
Cardano (ADA): 18,9%
Bitcoin Has Climber Over 100 Percent in 2023
The largest cryptocurrency by market capitalization, bitcoin, maintains its top position among the Coinmotion listings when measured by the year-to-date metric, surging by almost 109 percent since the beginning of the year. As Bitwise’s Matt Hougan commented, bitcoin’s selling pressure has now been exhausted, leaving only low-time preference investors who have no intention to sell. At the same time, institutional and retail-level customers are entering the market.
“The problem is: There is basically no one left to sell bitcoin, but there are new people who want to buy.” – Matt Hougan
Hougan’s thesis is also supported by the accelerating collapse of exchange bitcoin reserves, with an even larger portion of the asset class ending up in cold storage. The growing divergence between spot prices and exchange reserves is a positive technical signal. At the same time, bitcoin’s increasing illiquid supply and rising demand could lead to a phenomenon known as a “supply shock.”
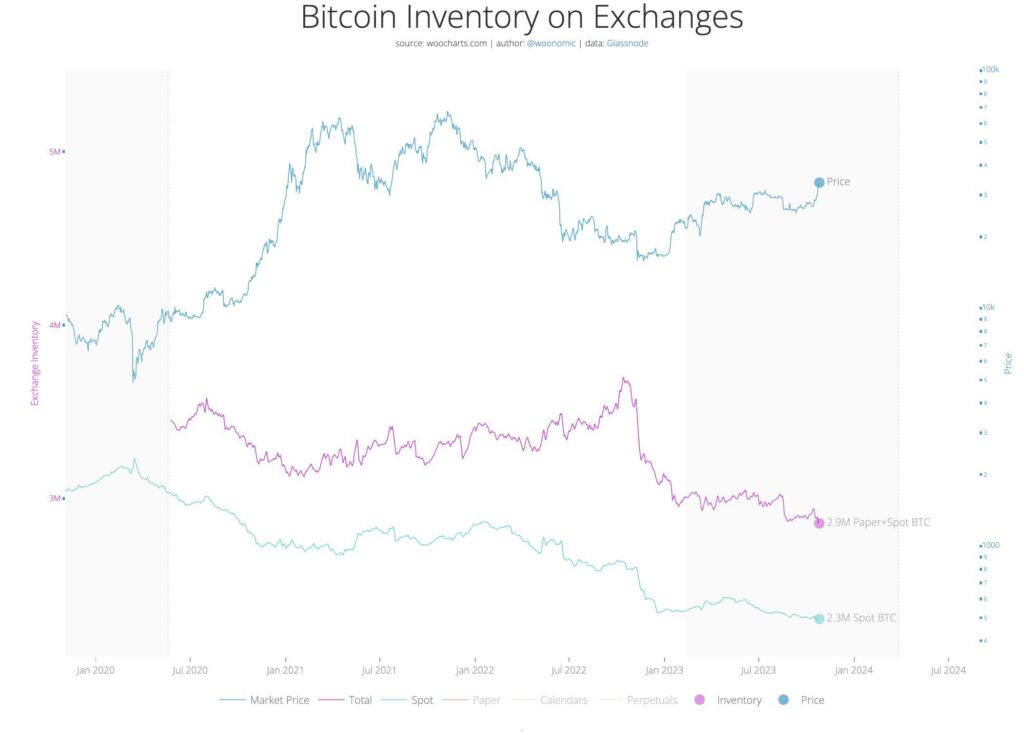
Source: Willy Woo
The most significant turnaround among Coinmotion-listed tokens is represented by Chainlink, with a 97% year-to-date increase after a lackluster early 2023. As recently as in June, Chainlink’s YTD price performance was close to zero and even occasionally negative. The third-largest surge is attributed to XRP, which has strengthened by 66% since the beginning of the year.
Source: TradingView
Litecoin, which experienced a significant crash in August, is once again approaching positive YTD figures, weakening by -2,6 percent since the beginning of the year. Uniswap, which made the controversial decision to introduce a 0.15 percent transaction fee last week, remains almost -20 percent in the red year-to-date. The “decentralized” solutions of Uniswap have clearly frightened investors, with the market reaction being strongly negative.
MicroStrategy’s DCA Above the Break-Even Again
The outlook of MicroStrategy, led by the iconic Michael Saylor, has significantly improved alongside the recent bitcoin ascent. CryptoQuant’s chart illustrates how bitcoin’s spot price, which reached $35 000 (violet), is now clearly above MicroStrategy’s realized price (red). Since the company’s realized price represents the average cost of all their bitcoin purchases, MicroStrategy is now clearly above its bitcoin-related profitability break-even.
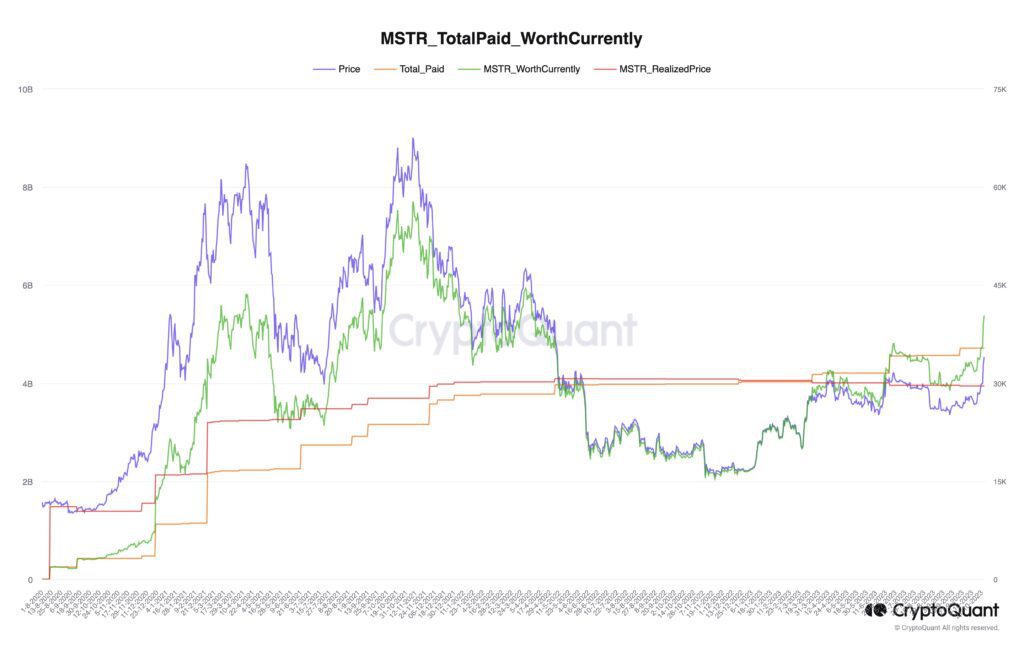
Source: CryptoQuant
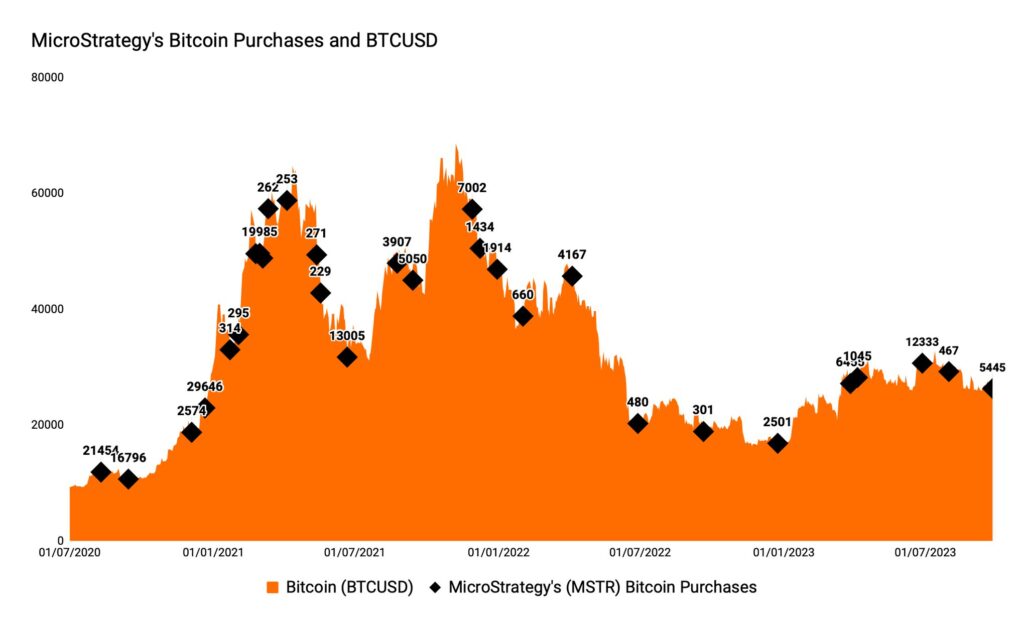
MicroStrategy employs Michael Saylor’s dollar-cost averaging (DCA) strategy in its purchases while simultaneously aiming to capitalize on the market’s natural cyclical patterns. The embedded chart illustrates the modesty of the company’s bitcoin acquisitions in 2022, a trend that is clearly contradicted by accelerating purchases in 2023.
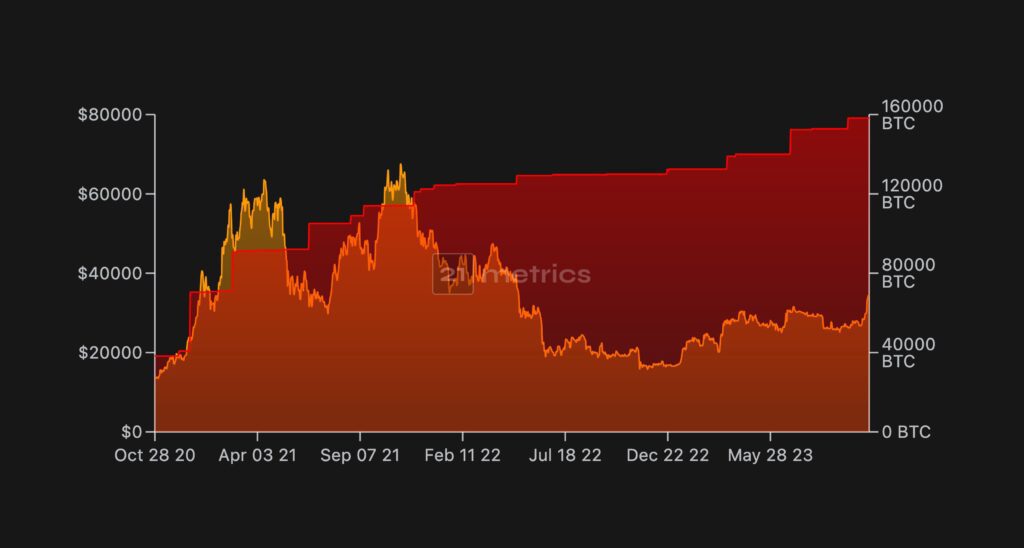
Source: 21metrics
Last year, the company’s bitcoin acquisitions amounted to a modest 8109 units as the market reached its epilogue towards the end of the year. With the economic conditions improving this year, MicroStrategy has once again accelerated its buying program, acquiring a total of 25 745 bitcoin units by October. Therefore, the company’s bitcoin acquisitions have increased by 217 percent by the end of October compared to the previous year.
Source: Coinmotion Research
The year-to-date growth of MSTR stock has already reached 199 percent, indicating that some bitcoin-related securities offer even better returns than the cryptocurrency itself. In the same time frame, the underlying asset class bitcoin has risen by 106 percent. From January to July, MicroStrategy’s ascent was even steeper, reaching a peak of 219 percent. Before the official approval of a spot ETF, MSTR may operate as an “unofficial ETF,” and due to its prominent position, it can be considered a leading indicator to bitcoin.
Bitcoin as a Physical Gold Alternative
The correlation between bitcoin and physical gold mimicking its scarcity properties (Tether Gold, XAUT) has now dipped into negative territory, oscillating near zero correlation. The negligible correlation reflects the divergence between bitcoin and gold, with the leading cryptocurrency strengthening by 106 percent in 2023. Meanwhile, XAUT has shown a modest 9 percent upward trajectory since the beginning of the year.
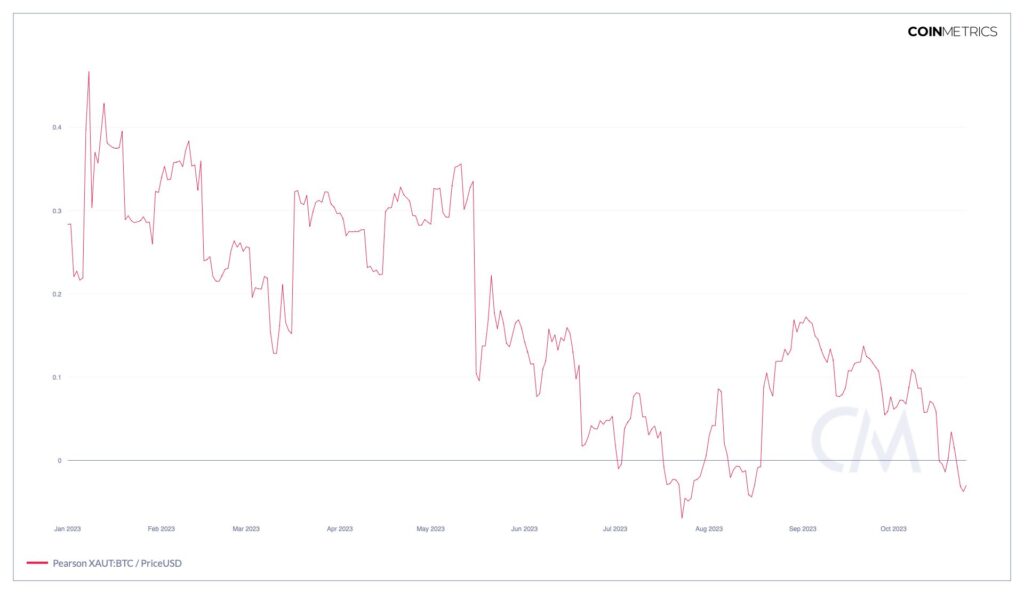
Source: Coin Metrics
In a recent report, Bloomberg commented on the relationship between bitcoin and gold, predicting an increasing divergence between the two asset classes. The company anticipates that a spot ETF will create a new wave of demand in the Bitcoin market. At the same time, Bloomberg notes that bitcoin’s volatility has significantly increased compared to gold.
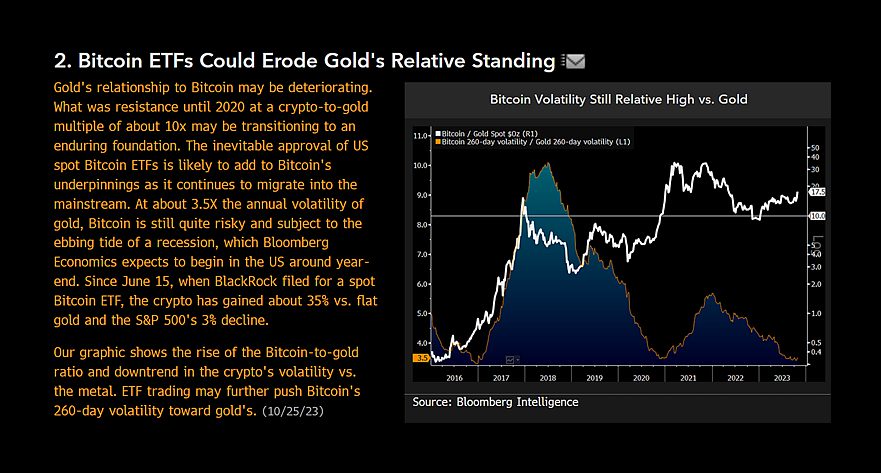
Source: Bloomberg
What Are We Following Right Now?
The momentarily forgotten Plan B’s stock-to-flow model still appears to be effective. The model’s standard deviation range suggests a valuation level for bitcoin between $31 000 and $103 000.
Analysis of bitcoin’s recent rally by Mark Yusko, known for his hedge funds.

Raoul Pal from Real Vision, Kevin Kelly from Delphi Digital, and Andreas Steno Larsen discuss Bitcoin, gold, and the cryptocurrency market in general.

Stay in the loop of the latest crypto events
- A Prologue to the Upcoming ETF Market Reaction
- Dive into Cardano (ADA): A newcomer’s comprehensive guide
- Security measures to safeguard your cryptocurrencies: Lesson #10
- Searching for Uptober
- 200 Days Until the Halving: Bitcoin’s Next Chapter
- Report your crypto investments to Verohallinto: Lesson #11
- Risk management strategies to minimize losses: Lesson #9
- How to send money home via crypto: Remittance made easy
- Aave: The DeFi Powerhouse Changing the Crypto Landscape

The views, thoughts, and opinions expressed in the text belong to the author and not necessarily to the author’s employer, organization, committee, or other group or individual.