

The technical analysis of week 48 scans the recent crypto rally and bitcoin’s essential $58 000 resistance level. Additionally, we analyze the year-to-date hierarchy of cryptocurrencies listed on Coinmotion and the performance of Ethereum.
The cryptocurrency market has maintained exceptional upward momentum over the past seven days, with bitcoin strengthening by over 15 percent. The market now reflects significant investor optimism, as they attempt to price in the expected spot ETF and the spring 2024 halving event.
Charles Edwards attributes crypto market’s bullish trend to the strengthening liquidity environment of the United States. Raoul Pal has long predicted a shift from central banks’ tightening measures (QT) to a moderate quantitative easing (QE). The return of quantitative easing is a significant driver for bitcoin’s value, as the global M2 money supply has been observed to correlate with bitcoin’s price.
“US Liquidity is trending up strongly, much like it did at the start of all prior Bitcoin bull runs. The relationship between US Liquidity and Bitcoin’s price is incredible. QE = number go up. QT = number go down.” – Charles Edwards
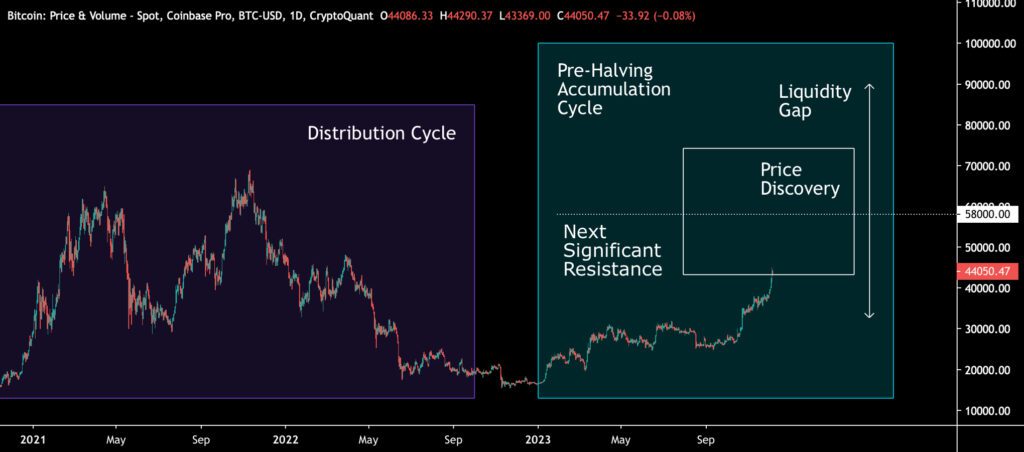
From a purely technical perspective, bitcoin has pierced through several weak resistance levels within the past two weeks, and the next significant technical resistance level is at $58 000 US dollars. Bitcoin’s price discovery cycle propels it higher as selling pressure decreases in inverse correlation.
Currently, there are significantly more buyers than sellers in the market, and the number of long-term hodlers is increasing. The growing number of hodlers could potentially lead to a phenomenon known as a supply shock, where the supply of liquid units decreases rapidly.
Sources: Timo Oinonen, CryptoQuant
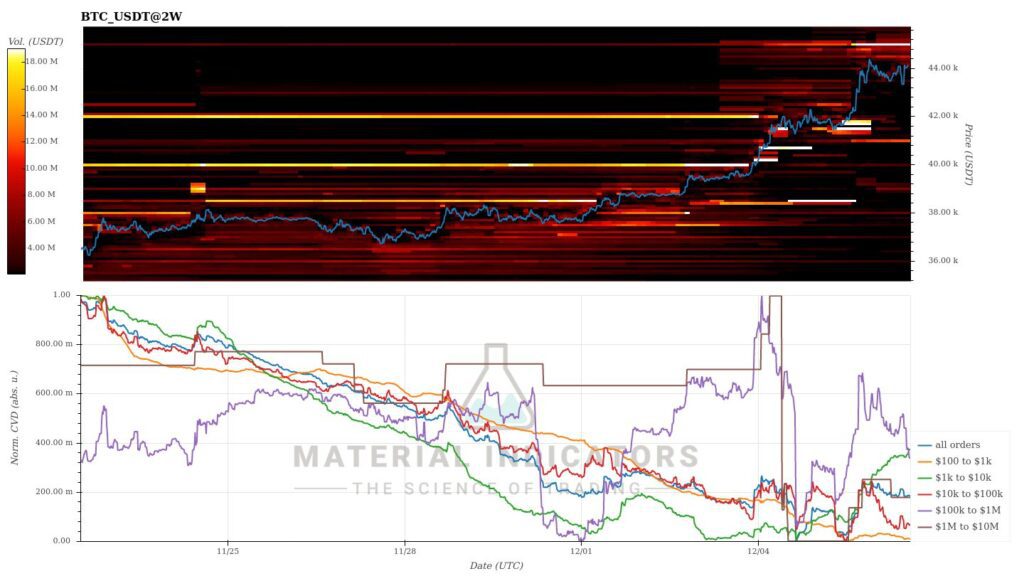
The Material Indicators heat map reflects a shift in the technical setup as bitcoin breaks through several critical resistance levels. At the same time, a robust support level has formed at $41 000. The Cumulative Volume Delta (CVD) indicates a pause in demand after the nearly parabolic price surge.
Source: Material Indicators
7-Day Price Performance
In the past seven days the leading cryptocurrency by market capitalization, bitcoin, has distinctly separated itself from altcoins, posting a gain of 15,7%. Ethereum, which was previously strongly correlated with bitcoin, saw a weekly increase of less than ten percent, while Litecoin rose by less than four percent. A surprising performer in the altcoin space is Cardano’s ADA token, which strengthened by 16,4% over the week.
Cardano (ADA): 16,4%
Polygon (MATIC): 7,9%
Gold: 0,9%
YTD Price Performance
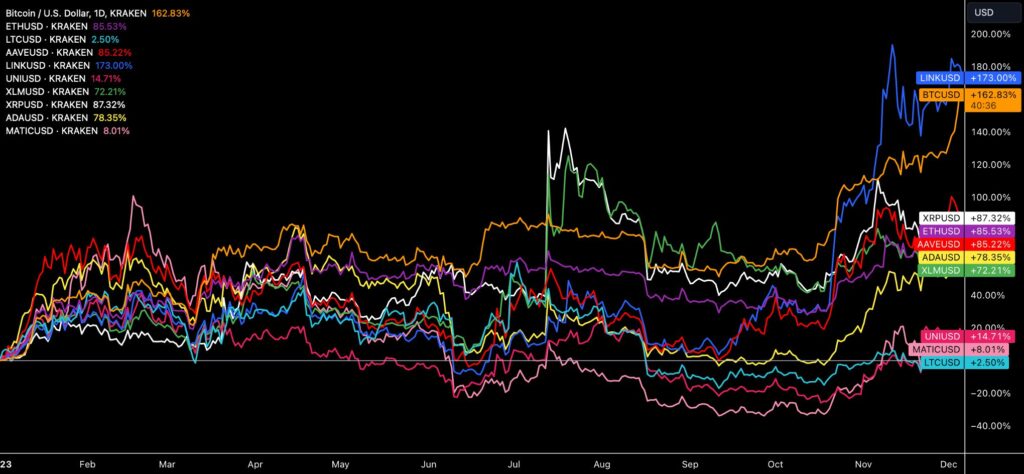
The crypto rocket Chainlink (LINK) narrowly holds its position at the top of Coinmotion’s listings, strengthening by 173 percent year to date. Bitcoin, which has surged almost parabolically in the past seven days, is closely trailing Chainlink, recording a YTD figure of 163 percent.
While all cryptocurrencies listed on Coinmotion are currently YTD-positive, many of them are at risk of falling behind the pace set by bitcoin and Chainlink. XRP, which received a commodity classification from the U.S. Securities and Exchange Commission (SEC) in July, has gained 87 percent since the beginning of the year. However, XRP’s upward momentum seems to be waning. Ethereum is also likely to fall below the one hundred percent mark in its YTD performance.
Source: TradingView
Having skyrocketed over 500 percent year to date, Solana (SOL) is flirting towards an altseason, although significant price surges in the altcoin space have been limited to a few currencies, for now. Currently the correct term would be a selective altseason, where a few chosen cryptocurrencies outperform bitcoin.
However, bitcoin’s rise will likely lead to an altseason eventually, as indicated by previous cycles. In the transition between 2017 and 2018, altcoins experienced a significant surge months after bitcoin reached its peak. The forthcoming high-beta rally may be further confirmed next year by the shift from quantitative tightening (QT) to quantitative easing (QE).
While the SOL token is not listed on Coinmotion, its purchase can be facilitated through our OTC team.
Ethereum Underperforms Despite Significant Supply Decrease
As indicated by the year to date (YTD) chart in the previous section, the well-known decentralized finance platform Ethereum has significantly lagged behind the momentum of bitcoin and selective altseason tokens. While bitcoin has surged almost parabolically by 163 percent since the beginning of the year, ETH’s figure now stands at 86%.
The growing divergence between the two largest cryptocurrencies by market capitalization is perhaps best illustrated by the ETHBTC pair, which has plummeted by -28% since the beginning of the year. Additionally, the previously high ETHBTC correlation (Pearson) has dropped from 0,9 in September to 0,7.
Source: TradingView
The Ethereum’s merge event was one of the most anticipated events of last year. In the the event, previous process layer (Ethereum mainnet) merged into the new PoS consensus layer (beacon chain). Post-merge, the Ethereum ecosystem has been secured with staked ETH instead of mining operations (PoW), reducing energy consumption by ~99,95% and optimizing future blockchain scalability upgrades.
The positive ripple effect of the merge was promoted by Ethereum being classified as a “green” and “ESG-friendly” blockchain. Asset managers are increasingly aware of ESG-related issues, and significantly lower energy consumption would make Ethereum more marketable to investors. With the green narrative, Ethereum could also differentiate itself from the PoW-based bitcoin.
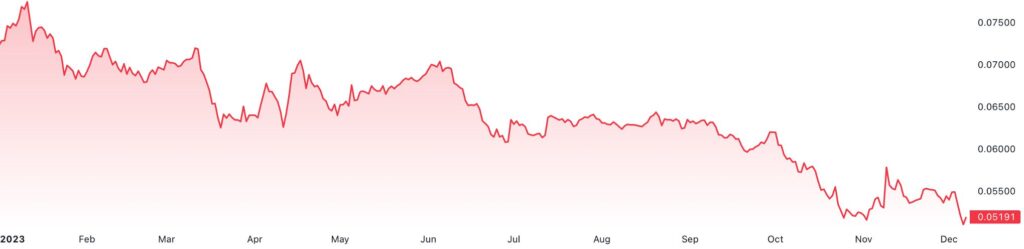
Despite the successful implementation of the merge, the mentioned value drivers have not translated particularly favorably into Ethereum’s price. The chart below shows a drastic reduction in Ethereum’s supply, but scarcity has not yet generated a supply shock.
So, what explains Ethereum’s weak performance? Firstly, bitcoin, the leading cryptocurrency by market capitalization, has dominated the space this year with the anticipated spot ETF and its approaching halving. These expectations have been priced into bitcoin’s spot at a record pace, somewhat leaving the Ethereum ecosystem on the sidelines.
With the liquidity environment still challenging, capital flows are directed towards a select few cryptocurrencies. Additionally, Ethereum faces increasing competition from ecosystems like Solana, and its previously highly profiled founder, Vitalik Buterin, has remained notably out of the media spotlight over the past year.
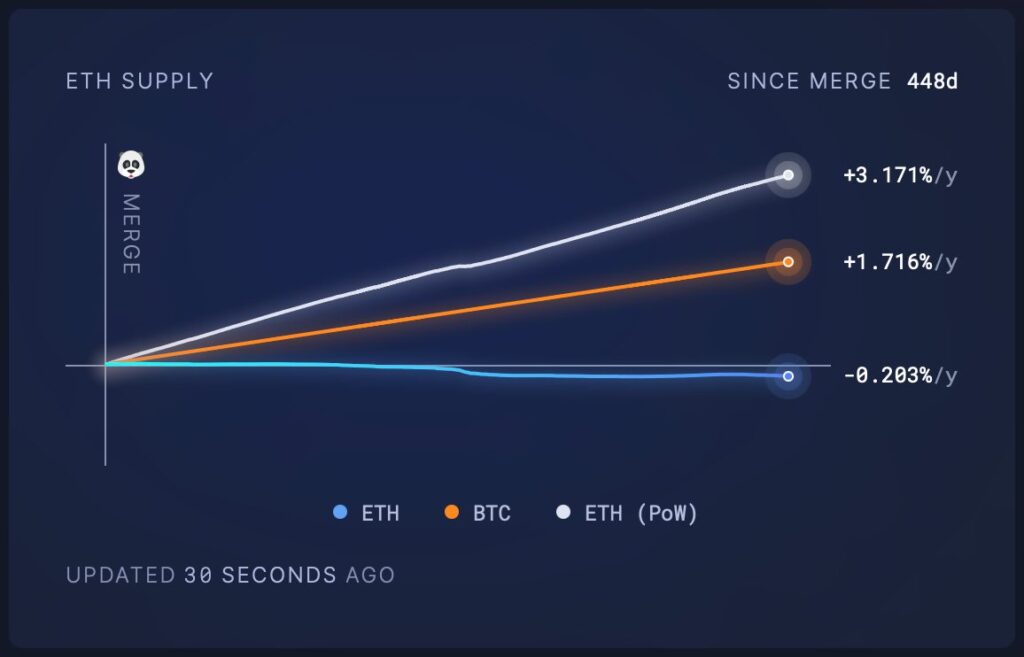
Source: Ultra Sound Money
How High Can the Cryptocurrency Market Still Rise in 2023?
As bitcoin surpasses YTD gains of over 160%, many investors are now pondering how high the market can still rise by the end of the year. The state of the derivatives market is indicated by the escalating number of short position liquidations (red), while bitcoin’s steep ascent builds short squeeze scenarios. In addition to the diminishing number of sellers, many traders are currently hesitant to short bitcoin because it’s challenging to assess the peak of the escalating price.
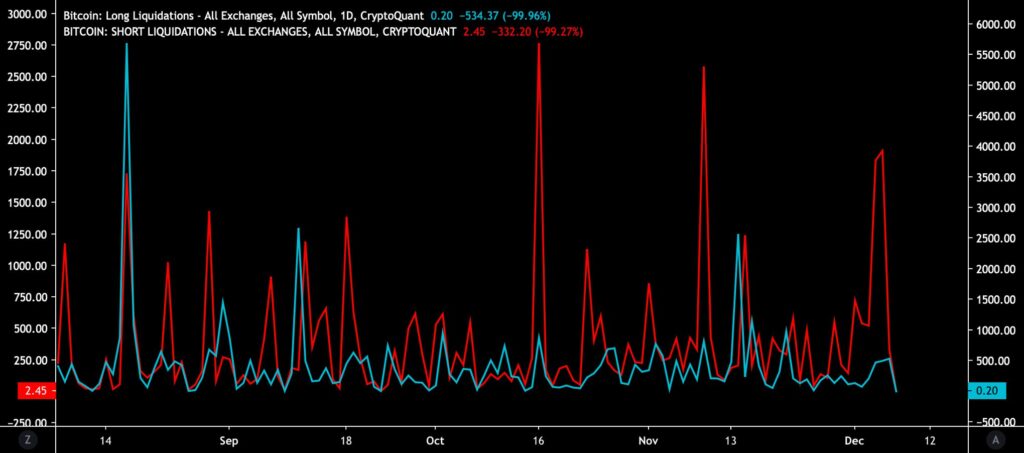
Source: CryptoQuant
In the previous technical analysis, the power-law model we introduced predicts bitcoin’s price rising indefinitely while noting a gradual slowdown in the pace over time. Capriole Investments’ recent chart models the liquidity environment and its impact on bitcoin. Charles Edwards’ thesis regarding the $58 000 resistance level simultaneously represents a suitable target price for the end of the year.
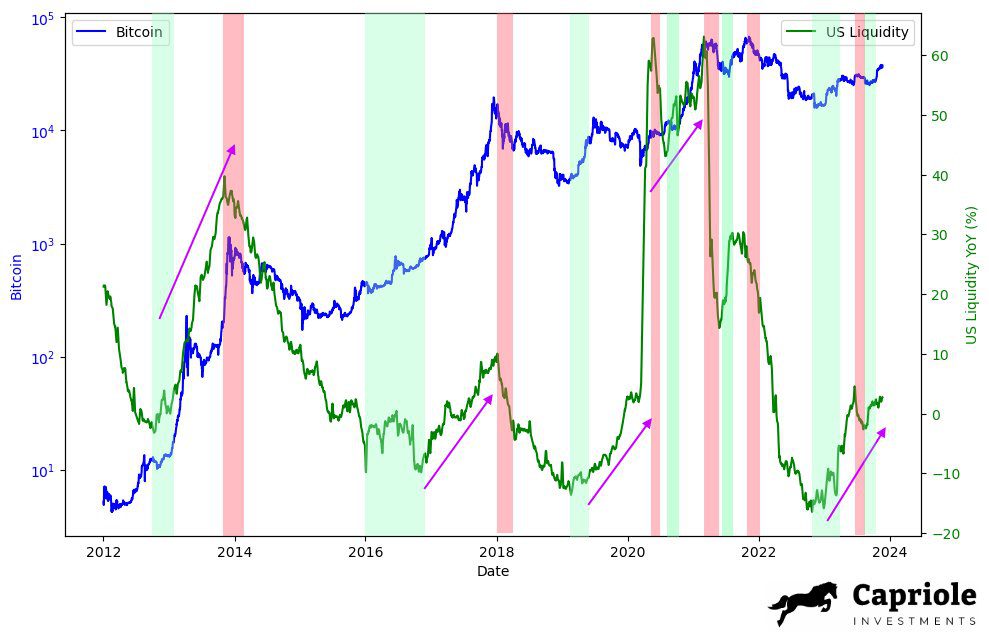
Source: Capriole Investments
Bitcoin’s Annual Candle is Resetting 2022’s Losses
With its impressive 163% surge this year, bitcoin’s performance is remarkable on its own. However, in the broader context, the ascent has an even more significant ripple effect: Bitcoin is resetting its losses and returning to the technical support levels of 2021 after the brutal bear cycle of 2022.
This presents a historically exceptional scenario as bitcoin has never before fully recovered from the negative price performance of the previous year to such an extent. For example, after the bear market of 2018, bitcoin only covered its losses in 2020. Simultaneously, this trend may indicate a shortening of bitcoin’s market cycles.
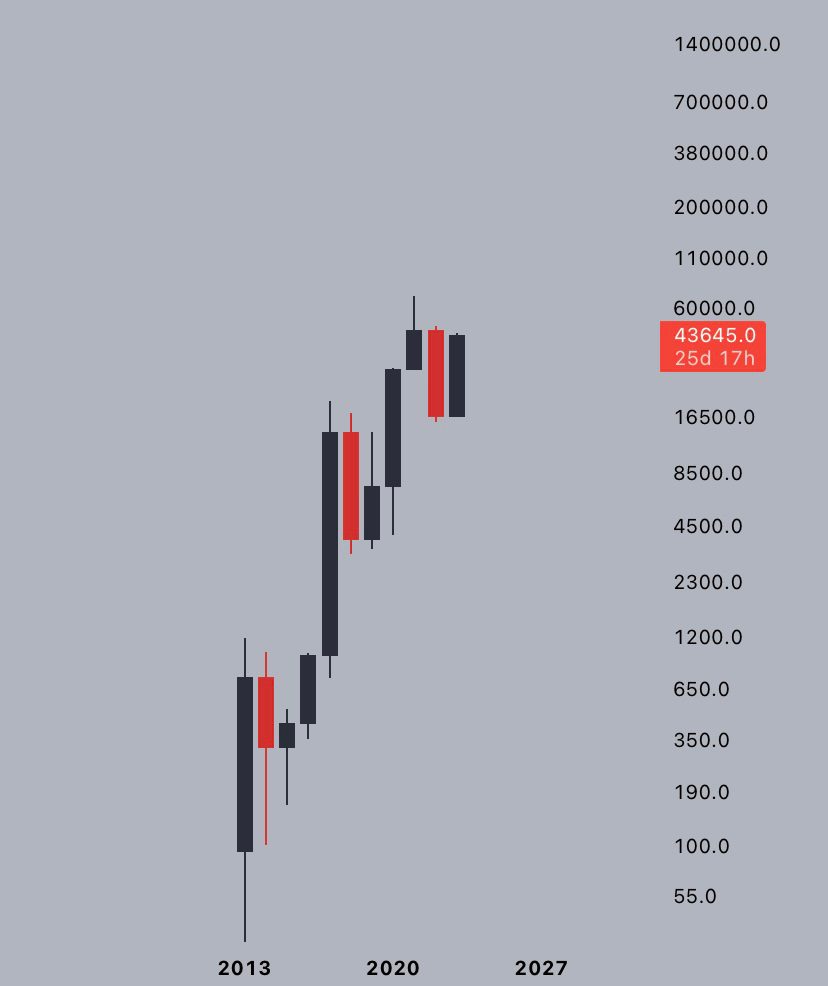
Source: TradingView
What Are We Following Right Now?
The decentralized finance platform Solana’s SOL token has surged by 547 percent since the beginning of the year. In a comprehensive interview with Raoul Pal, Solana Labs’ founder Anatoly Yakovenko discusses how the platform weathered the FTX crash. Additionally, Yakovenko outlines Solana’s future prospects, the NFT market, and the Firedancer scaling solution.
While the SOL token is not listed on Coinmotion, its purchase can be facilitated through our OTC team.

The city of Lugano, which hosted the Plan B Forum back in October, has announced its acceptance of local taxes and fees using cryptocurrency transactions. The list of approved currencies currently includes only bitcoin and USDT, however this selection may expand in the future.
Maple Finance’s Quinn Thompson analyses the outlook for bitcoin beyond $40 000.

Stay in the loop of the latest crypto events
- Bittrex Global shutdown — how to move funds from Bittrex to Coinmotion
- Binance’s Controversy & 150 Days to Bitcoin’s Halving
- Bitcoin and Power-Law Model
- Interest in Bitcoin ETFs persists in rising — Bitcoin value climbs 28% in October
- Polygon (MATIC) – Infrastructure for billion users
- Dive into Cardano (ADA): A newcomer’s comprehensive guide
- Security measures to safeguard your cryptocurrencies: Lesson #10

The views, thoughts, and opinions expressed in the text belong to the author and not necessarily to the author’s employer, organization, committee, or other group or individual.