
The technical analysis of week 49 maps out the technical correction of bitcoin and its subsequent market recovery. Additionally, we review insights from Coinbase Research, macro indices, and whale market behavior.
After the parabolic advance, the cryptocurrency market faced a technical correction this week, temporarily weakening bitcoin by almost ten percent. Despite the correction, the leading cryptocurrency by market capitalization has risen by 158 percent since the beginning of the year.
David Duong from Coinbase Research estimates that the demand for bitcoin comes from institutional sources, with CME’s annualized futures prices rising 29 percent higher than spot prices. The strength of institutional demand is also supported by Google’s search engine data, indicating the retail segment’s weak response to the price increase.
“Interestingly, a lot of the recent crypto appetite seems to be coming from institutional investors, as evidenced by the CME futures basis rising to as much as 29% annualized on bitcoin and 27% on ether early in the week. This suggests that institutions without recourse to BTC and/or ETH spot access may have been paying a larger-than-average premium for crypto exposure.” – David Duong, Coinbase Research.
From a purely technical perspective, bitcoin’s correction has not invalidated the technical structure of 2023, even though selling pressure is currently testing investors’ convictions. Bitcoin is still within the price discovery cycle above $40 000 (yellow), and the rising trendline of 2023 intersects with a multi-year confluence zone (white). It is worth noting that the current valuation levels of the price discovery cycle are already comparable to the distribution phase of the previous years 2021-2022 (purple).
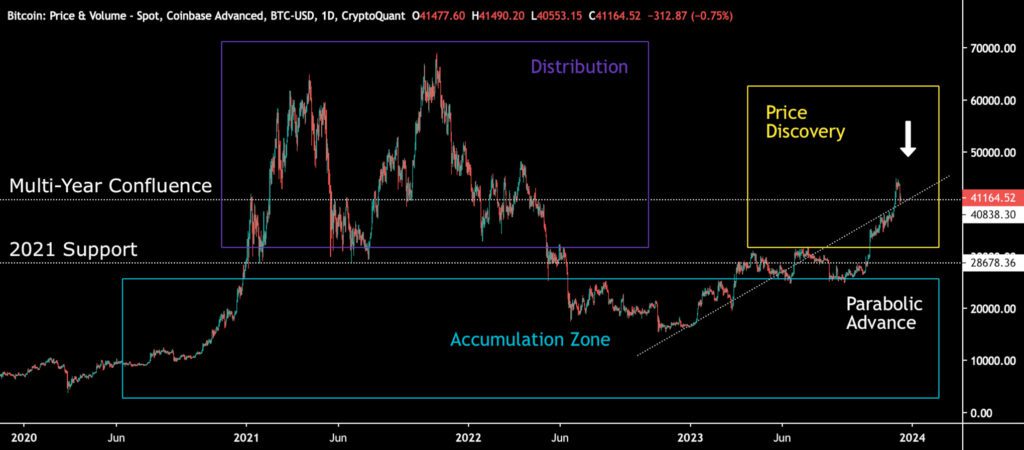
Sources: Timo Oinonen, CryptoQuant
The Material Indicators’s heat map reflects the rapid recovery of spot prices after the technical correction. Simultaneously, a relatively weak support level has formed around $40 000, and a strong support level is established around $38 000. A break below $38 000 would indicate escalating selling pressure. Cumulative volume delta means diminishing short-term demand across all investor groups.
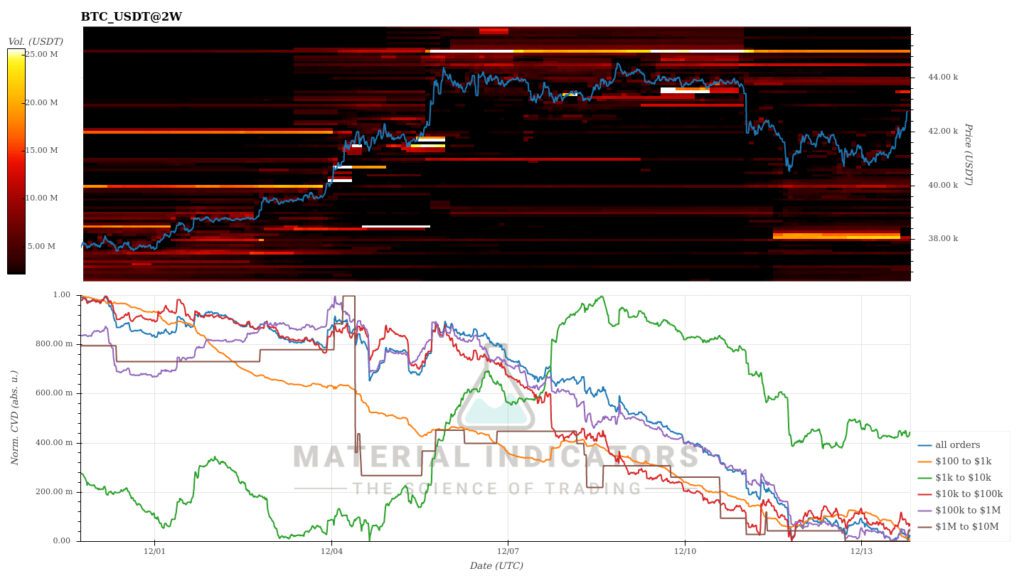
Source: Material Indicators
Seven Day Price Performance
The cryptocurrency market movement has remained mostly sideways since last week, with bitcoin recovering almost to its levels before the technical correction. A surprise performer among Coinmotion’s listings is Cardano (ADA), with a weekly strengthening reaching 45 percent.
The Federal Reserve’s FOMC meeting on Wednesday significantly boosted the S&P 500 index, which has risen 3,5 percent on a weekly basis. The FOMC kept the current interest rate unchanged, while Goldman Sachs predicts a 25 basis point cut in March. This suggests that the U.S. central bank policy is again at a turning point, shifting from the previous quantitative tightening (QT) to gradual easing (QE).
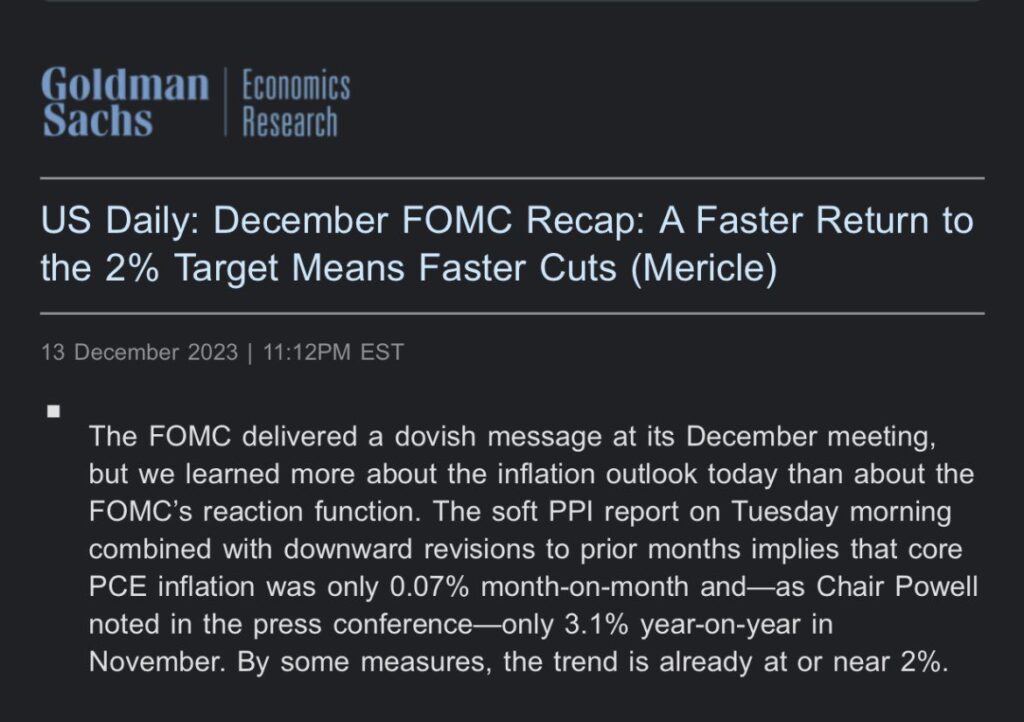
Source: Goldman Sachs
Cardano (ADA): 45,2%
Polygon (MATIC): 5,9%
YTD Price Performance
Even though the 2023 crypto rocket Chainlink (LINK) maintains its position at the top of Coinmotion’s listings, the mutual YTD hierarchy of cryptocurrencies is undergoing a significant upheaval. Bitcoin, which long held the second position (158%), fell to third place this week as Cardano clocked in with a 160 percent YTD figure. In the case of Cardano, a real paradigm shift can be observed as just in October the ADA token had a negative YTD performance.
Solana (SOL), exponentially surging 637 percent since the beginning of the year, along with Chainlink and Cardano, hint at the dawn of an emerging altseason, although it is targeting a narrow range of tokens. However, the current “selective altseason” may scale up in 2024. Bitcoin, Ethereum, and XRP, which received commodity classifications from the U.S. Securities and Exchange Commission (SEC) this summer, continue to maintain strong positions.
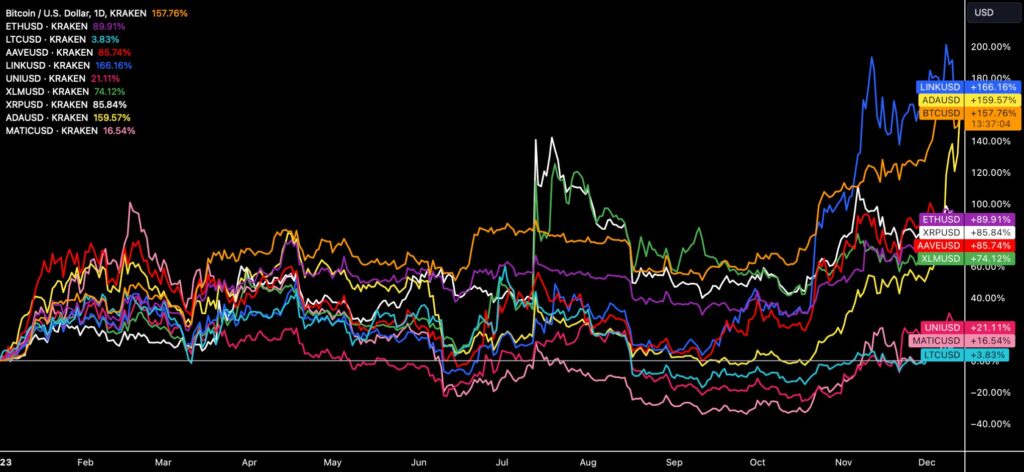
Source: TradingView
The exceptionally weak four percent YTD performance of the “legacy crypto” Litecoin may indicate a rotation among altcoins, where older tokens are losing favor with investors. Despite investor interest in Litecoin’s August halving event, the cryptocurrency suffers from a lack of investment narrative. The competition among altcoins seems to be intensifying further, with elevated valuation levels increasing the supply of new crypto projects. At the same time, accommodative central bank policies may result in a “cheap dollar” flowing into high-beta digital assets in the medium term.
While SOL tokens are not listed on Coinmotion, our OTC team can facilitate their purchases.
Capriole’s Macro Index Predicts Continuation of Bullish Trend
The latest technical correction has put some investors on edge, but bitcoin’s spot price appears to be bouncing back towards the $43 000 valuation. The technical correction can be viewed as a “long flush” move in the futures market, where long futures positions were cleared. Similarly, the market has witnessed several “short squeeze” scenarios, where short positions were liquidated after a prolonged downtrend.
In the bigger picture, the positive sentiment around bitcoin is supported by Capriole Investments’ algorithm-based macro index. Leveraging machine learning, the index weighs various fundamental blockchain and macro data.
From the macro index’s perspective, after a somewhat uncertain start to the year bitcoin has now entered an expansion phase (light green), resembling the setup seen at the turn of 2020-2021. Following the capitulation of late 2022, the macro index has mainly included contraction (red) and recovery phases (dark green).
If bitcoin’s price trajectory mirrors the 2020-2021 cycle, a similar parabolic price trend may be on the horizon, propelling the spot price beyond $100 000 in both dollars and euros. The macro index also provides crucial data about a potential market cooling: When the momentum started to fade in 2021, the macro index signaled the market entering a slowdown phase (yellow).
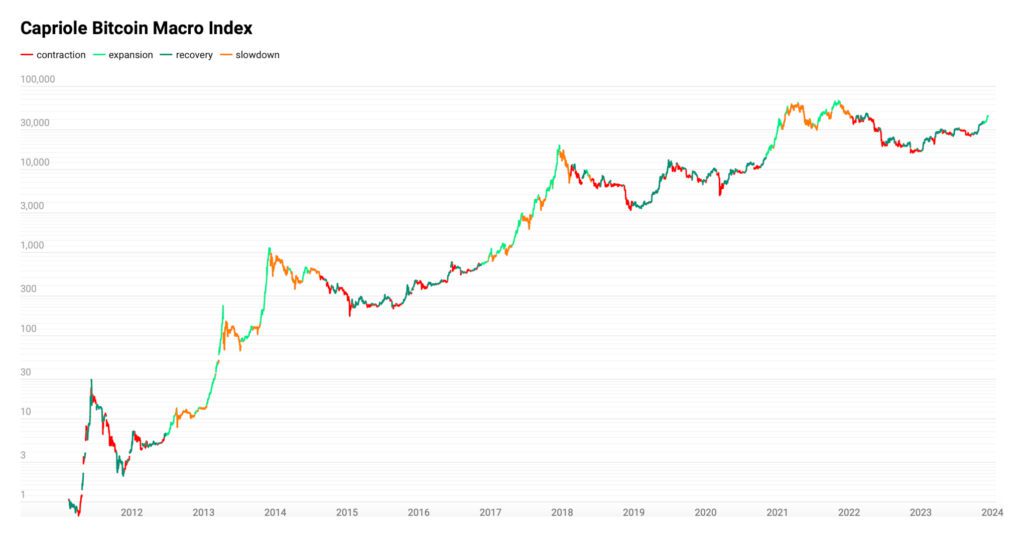
Source: Capriole Investments
Whales vs. Retail
While the leading cryptocurrency by market capitalization, bitcoin, has strengthened by 158 percent since the beginning of the year, the demand still emanates from a relatively narrow sector. Google search engine metrics indicate that the interest from the retail segment, i.e., individual customers, remains subdued.
Instead of the retail segment, the primary driver of demand comes from institutions, mainly focused on the anticipated spot ETF. According to the CME’s COT (Commitment of Traders) metrics we examined in previous technical analyses, asset managers are inclined towards long derivative positions. Hedge funds, on the other hand, have traditionally taken short positions on bitcoin.
Sources: Timo Oinonen, CryptoQuant
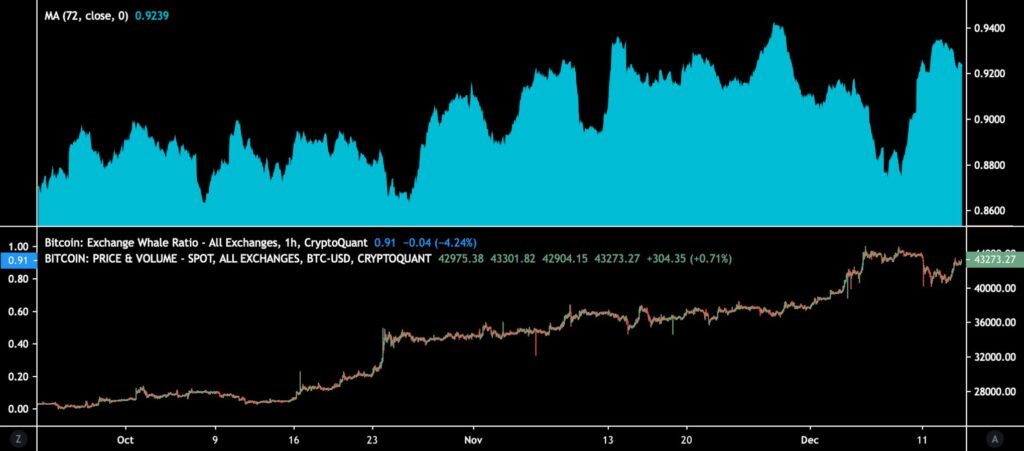
The thesis of institutional dominance is supported, among other things, by CryptoQuant’s exchange whale ratio, indicating a significant increase in large exchange-based buyers in the last three months. Meanwhile, Glassnode’s trend accumulation data reveals that entities holding over 10 000 bitcoins were clearly in an accumulation mode from October to November but then moderately reduced their purchases in December.
According to Glassnode’s chart, entities owning less than 10 000 bitcoins continue to accumulate. Overall, this marks the most significant accumulation trend throughout the year 2023. Interpreting Glassnode’s data, the monthly purchase volume for all cohorts is around 36 000 bitcoin units, while the monthly issuance of bitcoin is in the ballpark of 27 500 units.
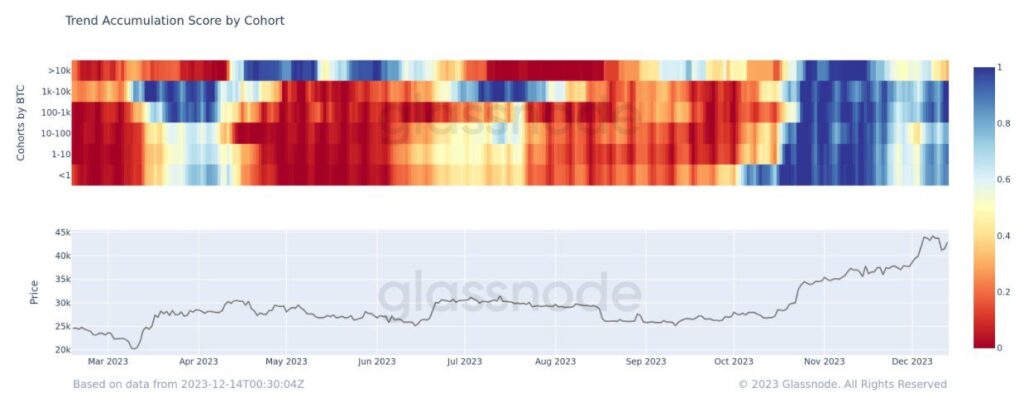
Source: Glassnode
Another clear whale indicator is MicroStrategy (MSTR), which has increased its holdings to a total of 174 530 bitcoin units in 2023. Positioned as an institutional pioneer, the company has acquired a total of 42 030 bitcoins this year, compared to a modest 8109 units in the previous year. Therefore, MSTR’s purchasing program has grown by 418 percent from 2022 to 2023. In addition to reflecting institutional appetite, MicroStrategy can be considered a leading indicator to the underlying spot price itself.
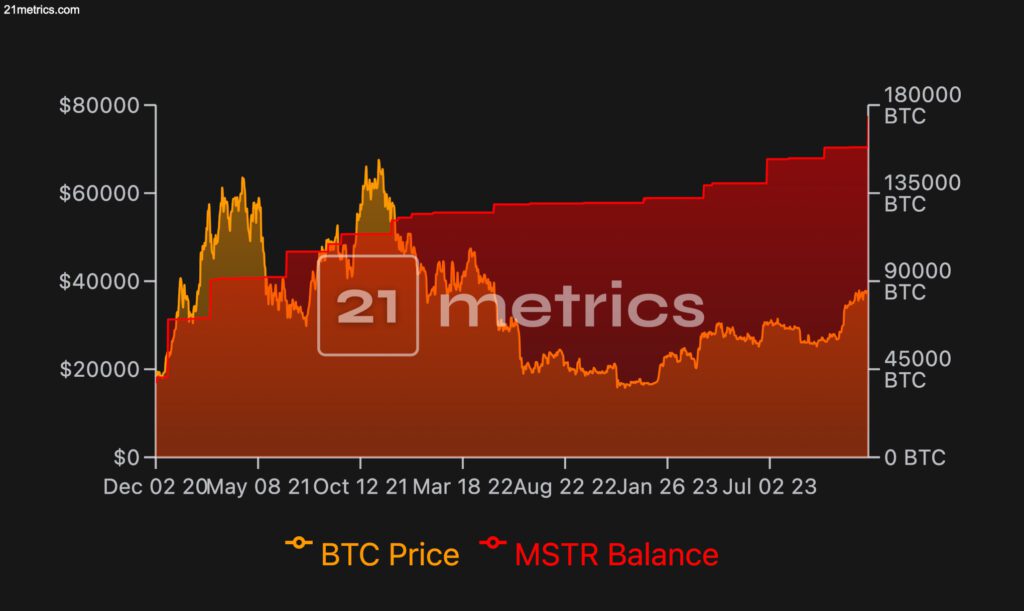
Source: 21metrics
What Are We Following Right Now?
Asset management firm M&G has made a $20 million investment in a platform offering crypto derivatives. While the size of the investment is relatively small, it signals institutional interest in digital assets. As mentioned at the beginning of the analysis, David Duong from Coinbase Research estimated that the organic demand for bitcoin is coming from institutions, especially as CME futures prices have climbed 29 percent higher than spot prices.
Mike Novogratz, known for his company Galaxy Digital, provides a market overview discussing the macroeconomic environment, fiat and crypto ecosystems, and outlooks for the year 2024.

Tim Grant assesses that the spot ETF will increase the reflexivity of the cryptocurrency market.

Stay in the loop of the latest crypto events
- Dive into Cardano (ADA): A newcomer’s comprehensive guide
- Bittrex Global shutdown — how to move funds from Bittrex to Coinmotion
- The Next Technical Resistance at 58 000 USD
- Binance’s Controversy & 150 Days to Bitcoin’s Halving
- Polygon (MATIC) – Infrastructure for billion users
- Bitcoin and Power-Law Model
- Interest in Bitcoin ETFs persists in rising — Bitcoin value climbs 28% in October

The views, thoughts, and opinions expressed in the text belong to the author and not necessarily to the author’s employer, organization, committee, or other group or individual.