

The technical analysis of week 47 maps the market’s anticipatory sentiment and bitcoin’s gradual price increase. Additionally, we analyze bitcoin’s power-law model and MicroStrategy’s balance sheet. Is MicroStrategy’s buying program a speculative attack against the dollar?
The crypto market sentiment has remained positive since last week, with bitcoin strengthening by two percent. The leading cryptocurrency by market capitalization managed to surpass the critical $38 000 resistance level between Tuesday and Wednesday night.
Nikolaos Panigirtzoglou, a strategist at JPMorgan investment bank, commented on the market of digital asset classes in his recent report. According to him, Binance’s settlement clarifies the industry and once again lowers the institutional threshold to participate in the ecosystem.
“The Binance settlement is reinforcing an ongoing shift towards regulated crypto entities and instruments which has been the objective of US authorities post FTX collapse. Such a shift towards regulated crypto entities and instruments should be positive for the crypto ecosystem as more regulation will help attract the interest of traditional market participants and investors.” – Nikolaos Panigirtzoglou
In the same report, Panigirtzoglou commented on the potential ETF conversion of Grayscale Bitcoin Trust (GBTC) and its consequences. JPMorgan predicts GBTC outflows to be $2,7 billion, with a minimal impact on the market. Panigirtzoglou assumes that the high 2 percent management fee of GBTC would decrease to 50-200 basis points following the conversion.
The nearly 130 percent year-to-date growth of bitcoin is also supported by central banks gradually returning to quantitative easing (QE) after the quantitative tightening (QT) during the COVID period. However, according to Holger Zschaepitz, the hawkish stance of the European Central Bank has continued, with the balance sheet decreasing by 5,3 billion euros.
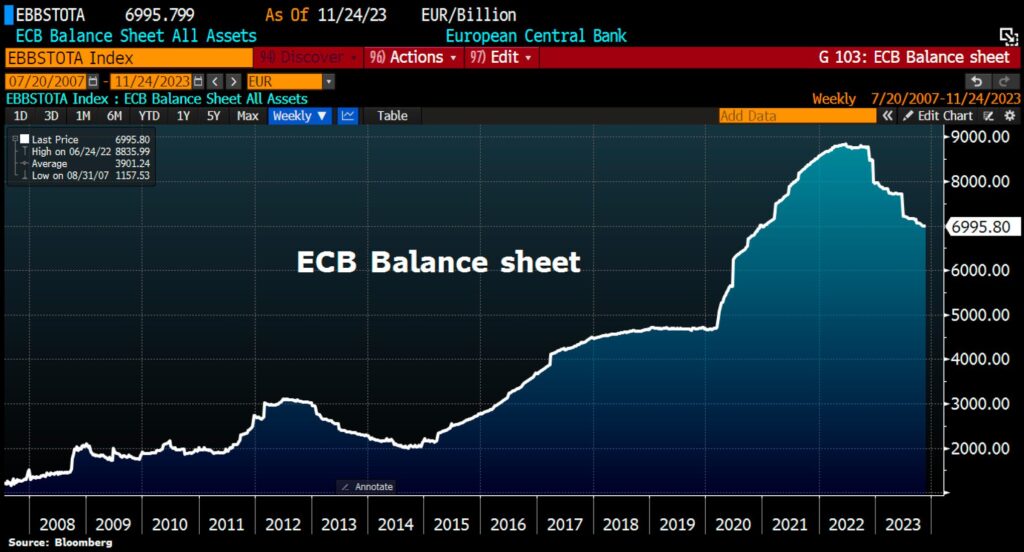
Source: Bloomberg
From a purely technical standpoint, the market setup looks exceptionally promising. Bitcoin has transitioned into a new price discovery phase after an uncertain early autumn and is already aiming for $40 000. According to expert Charles Edwards, the next significant resistance level is only at $58 000.
The turquoise wave of bitcoin’s realized price is now above $21 000, reflecting the average price of all purchases. With the spot price oscillating around $38 000, the realized price indicates that the majority of bitcoin investors are strongly in profit.
At the same time, the realized price 6M-12M (blue) and 12M-18M (violet) UTXO waves are intersecting, forming a setup reminiscent of spring 2021. In the bigger picture, the market is looking towards the spring 2021 halving event, which is only 144 days away.
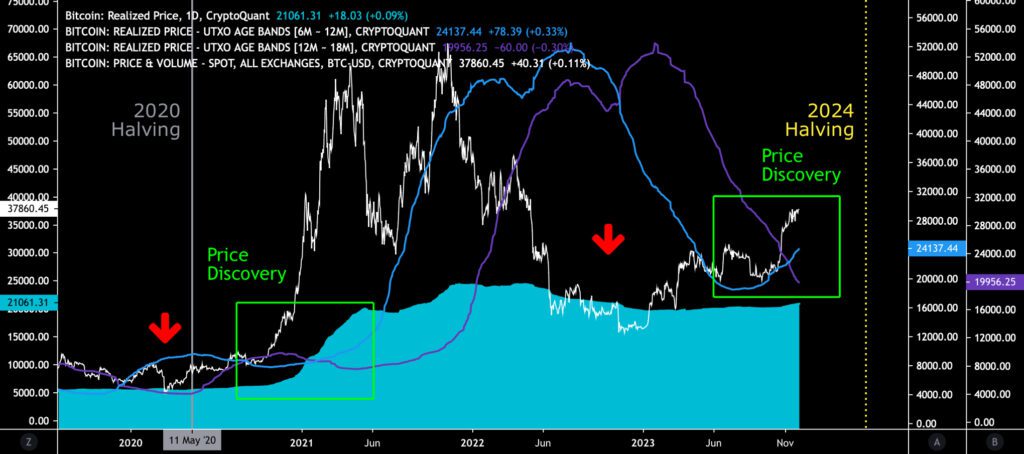
Sources: Timo Oinonen, CryptoQuant
The Material Indicators’ heat map indicates the strengthening of the $38 500 resistance level. At the same time, the Cumulative Volume Delta (CVD) reflects a dilution of short-term demand among all market participants.
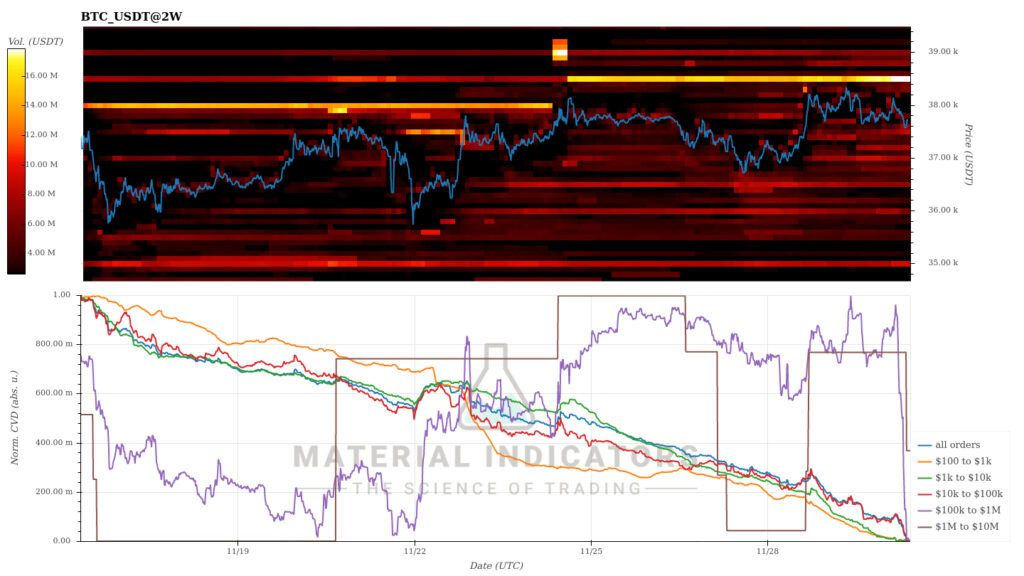
Lähde: Material Indicators
Over the past seven days, the market has mostly moved sideways, with bitcoin and Ethereum showing their familiar correlation. The price development of higher-beta altcoins has been unusually muted, with their movements remaining within a few percentage points. The market sentiment is currently anticipatory, with investors closely monitoring news in the spot ETF field and the approaching halving event in spring.
7-Day Performance
Cardano (ADA): -3,2%
Polygon (MATIC): -1,0%
YTD Price Performance
Chainlink (LINK), which previously reached an almost 200 percent year-to-date (YTD) figure, continues to maintain its position at the top of the Coinmotion listings. LINK has strengthened by 163 percent since the beginning of the year. In the second position is the leading cryptocurrency by market capitalization, bitcoin, with a rise of 130 percent since the start of the year. Aave, founded by Stani Kulechov with Finnish background, has surpassed XRP in YTD performance, boasting a 91 percent increase compared to XRP’s 80 percent.
There are indications in the market of a potential “altseason” as Aave climbs into the top three. The summer division line drawn by the U.S. Securities and Exchange Commission (SEC) still defines the crypto landscape, with bitcoin, Ethereum, and XRP enjoying commodity classifications. However, concerns about security classification and regulatory risks may now be diminishing as altcoins perform strongly.
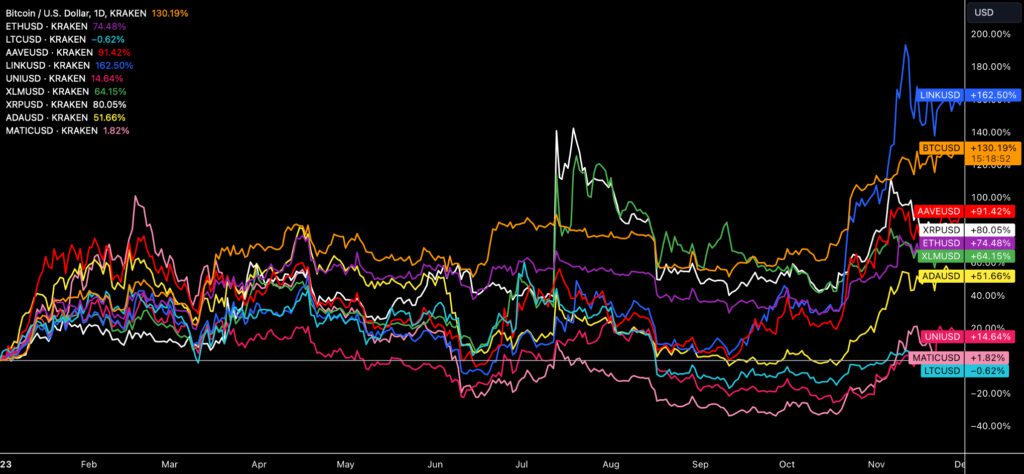
Source: TradingView
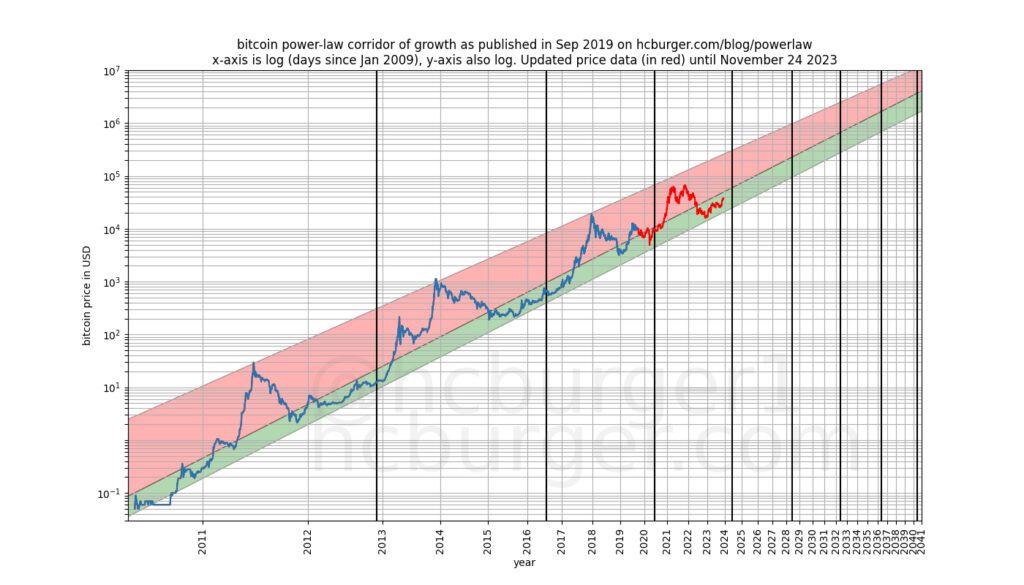
Bitcoin’s Power-Law Model
The power-law model developed by Harold Christopher Burger is a valuable tool for understanding the long-term direction of the Bitcoin market. The power-law establishes support (green) and resistance (red) levels for bitcoin, guiding the upward trajectory of price development. The power-law predicts that the price of bitcoin will continue to rise indefinitely but notes that the pace of ascent will gradually slow over time.
The power-law model is based on the following assumptions:
A. Bitcoin is in a continuous long-term uptrend, but its rate of ascent decreases over time.
B. Bitcoin’s volatility decreases over time.
C. Bitcoin will not surpass the $100 000 threshold before the year 2021 (fulfilled).
D. After 2028, the price of bitcoin will not fall below $100 000.
E. The model assumes that the price of bitcoin will rise to a million dollars between 2028 and 2037.
F. After 2037, the price of bitcoin will not fall below a million dollars.
Source: Harold Christopher Burger
It’s essential to remember that the power-law model assumes that bitcoin’s historical price development predicts the future. It does not account for factors such as macro market changes and potential black swan events. In contrast to the power-law model, Raoul Pal has proposed that the price of bitcoin correlates strongly with the M2 money supply aggregate. Tim Stolte has criticized the power-law model, questioning the compatibility of the logarithmic scale and the X-axis.
Michael Saylor in Bull Mode Again
MicroStrategy (MSTR), positioned as one of the leading institutions in the industry, continued its purchase program on Thursday, expanding its balance sheet by 16 130 new units. The transaction recorded on the last day of November increases the company’s balance sheet by over 10 percent.
MicroStrategy employs Michael Saylor’s dollar-cost averaging (DCA) strategy in its purchases while simultaneously seeking to capitalize on the natural cycles of the market. The accompanying chart illustrates the modest bitcoin purchases by the company in 2022, contrasting sharply with the accelerated buying seen this year.
In 2022, MSTR’s purchases amounted to a modest 8109 units as the market experienced capitulation in the latter part of the year. Purchases for this year have already climbed to 42 030 units since the beginning of the year, representing a 418 percent growth in the buying program compared to the previous year.
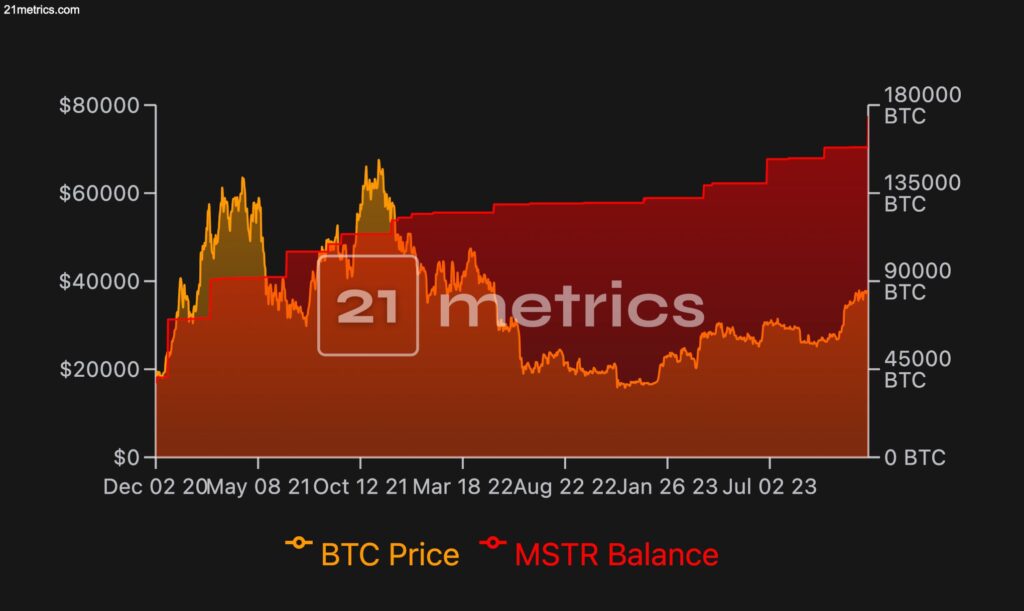
Source: 21metrics
MicroStrategy’s (MSTR) stock has surged significantly since the beginning of the year, rising a total of 244 percent. The stock aligns with the insights of expert Jeff Booth, who argues that certain Bitcoin-related stocks offer better returns than the underlying asset itself. MSTR has indeed strengthened almost twofold compared to bitcoin.
Michael Saylor unveiled his company’s Bitcoin strategy on August 10, 2020, and since then, the MSTR stock has climbed by 321 percent. MSTR reached its all-time high in February 2021, when the stock rose to $1034. Compared to February 2021, the current price of $498 still leaves room for further growth.
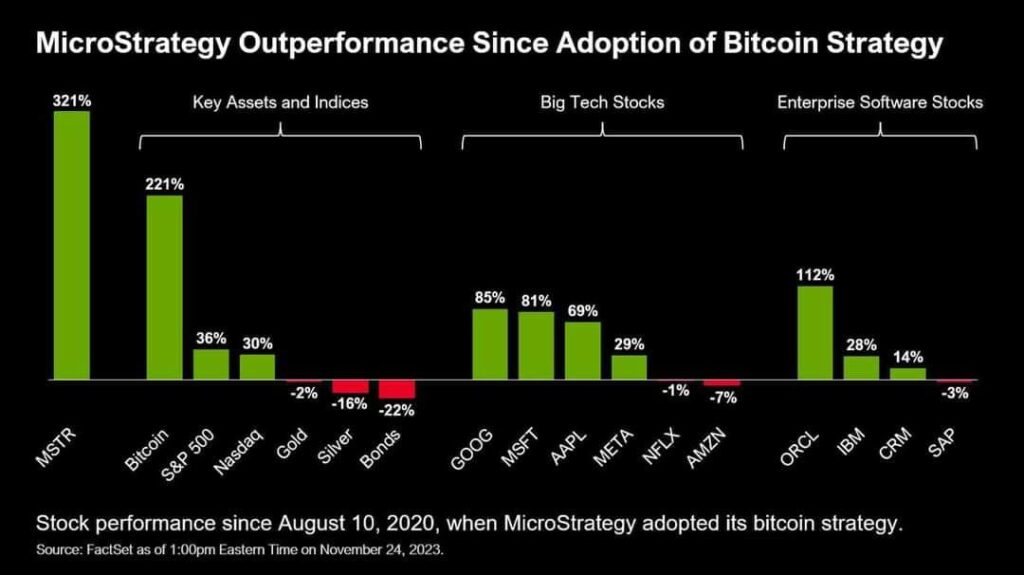
Source: FactSet
Is MSTR’s Purchase Program a Speculative Attack Against the USD?
MicroStrategy’s massive buying program naturally sparks interest, and some experts assess it as a “speculative attack against the dollar.” Specifically, the theory advocated by Preston Pysh interprets the company’s exotic loan arrangements as relying on unlimited fiat money borrowed for the limited supply bitcoin purchase program. Scaled, this model implies the perpetual weakening of the dollar as bitcoin continues to strengthen constantly.
Pysh draws parallels between the current buying program and George Soros’s famous attack on the Bank of England (BoE), where he shorted the pound with nearly a billion GBP. Some analysts estimate that the BoE was on the brink of collapse back then.
What Are We Following Right Now?
Binance’s challenges continue: The Securities and Exchange Commission of the Philippines announced that it is blocking Binance’s operations in the country, warning that the platform facilitates trading with unregistered securities.
Has the inflation peak been reached? Decreasing inflation figures in Europe, especially in Germany, enable a potential easing of the exceptionally tight monetary policy.

Jens Nordvig predicts a further weakening of the US dollar. The dollar has traditionally exhibited an inverse correlation to bitcoin and cryptocurrencies, implying that a depreciating USD could potentially strengthen BTC.

Stay in the loop of the latest crypto events
- Binance’s Controversy & 150 Days to Bitcoin’s Halving
- Bittrex Global shutdown — how to move funds from Bittrex to Coinmotion
- Interest in Bitcoin ETFs persists in rising — Bitcoin value climbs 28% in October
- Are We Approaching a Selective Altseason?
- Polygon (MATIC) – Infrastructure for billion users
- A 100 000 Dollar Target Price: The Bold Prediction and its Basis
- Report your crypto investments to Verohallinto: Lesson #11
- A Prologue to the Upcoming ETF Market Reaction
- Dive into Cardano (ADA): A newcomer’s comprehensive guide
- Security measures to safeguard your cryptocurrencies: Lesson #10

The views, thoughts, and opinions expressed in the text belong to the author and not necessarily to the author’s employer, organization, committee, or other group or individual.