
MARKET INSIGHTS
Table of Contents
BITCOIN DISRUPTS GOLD
- BTC YTD Performance: +60,22%
- Gold YTD Performance: -8,97%
Gold and Bitcoin are often seen as benchmarkable assets, both deriving their value from scarcity. Bitcoin’s scarcity is based on the limited amount of bitcoin units, theoretically peaking at 21 million. The amount of gold is not limited in similar fashion, yet it’s a scarce asset as well. While the two assets have been previously correlated, bitcoin has significantly outperformed gold in 2021, as the following indexed price performance chart shows. Gold rapidly dropped -4 percent in late August, combined with a limited amount of market liquidity.
The bitcoin/gold correlation dropped to -0,11 in August, following the gold’s flash crash. The correlation between bitcoin and gold hasn’t been this low since November 2018, when the correlation dropped below -0,2. In 2020, bitcoin and gold were historically correlated, rising to the proximity of 0,6. While gold has been perceived as an inflation hedge and “sound money” alongside bitcoin, the short-term narrative seems to be broken. Gold’s crash comes at a weird time as U.S. inflation data (CPI) shows inflation rising to 5,4 percent.

“I agree BTC is disrupting gold. I have also found that relatively few Bitcoin maximalists recognize how BTC disrupting the status quo system will likely paradoxically require the status quo system to use gold to defend the status quo system from said disruption.”
– Luke Gromen.
Luke Gromen, the founder of FFTT LLC, sees Bitcoin disrupting gold over a long time horizon. He also makes an interesting remark that the “status quo system” would need to increase its gold holdings to hedge Bitcoin’s disruptive effect.
BITCOIN LEADING IN SHARPE RATIO
All asset classes include risk and profit expectations. The primary fundamental of investment activity is that return should compensate for higher risk over a long investment horizon. The Sharpe ratio is an effective instrument for estimating risk and return. Sharpe can easily be calculated by deducting a risk-free rate from the expected return and dividing the result by standard deviation.
Sharpe ratio interpretations:
- < 1: Weak
- 1 – 1,99: Mediocre
- 2 – 2,99: Good
- > 3: Excellent
While Ethereum had a higher Sharpe ratio than Bitcoin in early 2021, it has recently dropped below Bitcoin (2,32) to 2,16. Both digital assets fit into the “good” Sharpe ratio category. As mentioned before, Gold has been performing poorly in 2021 and is currently negatively correlated with Bitcoin. Gold’s Sharpe of 1,26 mirrors gold’s poor price performance.
ETHEREUM HARD FORKS TO EIP-1559, BECOMES MORE SCARCE
Ethereum, the second-largest digital asset by market capitalization, is implementing fundamental changes between 2021-2022, the most recent upgrade being the London hard fork and its EIP-1559 upgrade.
The London hard fork includes five Ethereum improvement proposals (EIPs): 1559, 3554, 3529, 3198, and 3541. These five upgrades aim to improve Ethereum’s value proposition and user experience (UX).
The big picture of Ethereum upgrades seems to be making the network more scarce by reducing supply and preparing ETH for upcoming Proof of Work (PoW) -> Proof of Stake (PoS) conversion. As the website ultrasound.money reflects, Ethereum’s supply is expected to peak in early February 2022 at 119,3 million Ether units.

Although “ultra-sound money” may sound like a meme and was possibly created as a marketing term, it correctly mirrors the ongoing change that makes Ethereum scarce and even deflationary in the future. After the 119,3 million native unit peak, the supply horizon is expected to decrease gradually.
BURNING ETHEREUM
As mentioned before, the long-term goal is to make Ethereum more scarce, “ultra-sound money.” The network has consequently started to burn ETH supply, currently over 701 million USD worth of it, with a burn rate of 4,29 native Ether tokens per minute. EIP-1559 removes (or burns) a certain amount of ETH from the circulating supply each time a transaction is processed. EIP-1559 has also replaced Ethereum’s auction-style transaction fee mechanism with an algorithmic alternative. Now miners no longer receive transaction fees as the fees are burned, effectively reducing Ethereum’s circulating supply.
The NFT platform OpenSea is leading the amount of Ether tokens burned after the EIP-1559 upgrade. So far, OpenSea has burned a total of 27967 tokens, while the decentralized exchange (DEX) Uniswap (UNI) V2 takes second place with 10937 Ether burned. The Ethereum version of stablecoin Tether (USDT) takes third place with 8721 Ether burned.
COMPETITION WITH BITCOIN
- BTC YTD Performance: +60,22%
- ETH YTD Performance: +352,92%
The value propositions of Bitcoin and Ethereum are widely different, however we can still benchmark their price performance. As during previous years, ETH is much more volatile but tends to climb faster than the heavier BTC. Bitcoin ascended +60,22 percent year-to-date (YTD) and Ethereum +352,92%. In this setting, Bitcoin can be considered the de facto reserve currency of digital assets and Ethereum as an “altcoin.”
Bitcoin has been perceived as “digital gold,” and it has been successful in that role. Ethereum’s value proposition is more towards the decentralized finance (DeFi) ecosystem. However, Ethereum has recently been imitating Bitcoin’s main features like scarcity.
POW VERSUS POS
Whereas Bitcoin will most likely continue with the original Proof of Work (PoW) protocol, we expect Ethereum to shift into Proof of Stake (PoS) in early 2022. The PoW and PoS are fundamentally different, starting from PoW mining that revolves around computational power. In PoS, the blocks are not mined but validated by entities with enough stake.
In Proof of Work, the first miner to solve the computational puzzle gets the block reward. In contrast, in Proof of Stake, the network validators collect network fees, and to dominate the network, PoW users need 51 percent of the computational power, or in PoS, to own 51% of the network. Proof of Stake likely has an increased appeal to environmentally conscious users, as it allegedly uses less energy. Lower energy consumption would also make PoS (or future Ethereum) the preferred option for ESG investors and funds, even ETFs.
The downside of PoS is that it’s a relatively unproven system, while Proof of Work is well tested. PoW-based Bitcoin has been moving towards less energy consumption via many (ex-China) miners opt for greener mining infrastructure.
Proof of Work (PoW)
Proof of Stake (PoS)
STATE-LEVEL BITCOIN
2020 will be remembered by the emergence of the institutional bitcoin thesis, promoted by Microstrategy’s Michael Saylor and Elon Musk (Tesla, SpaceX). 2021 saw a completely new paradigm shift as the first country ever, El Salvador, announced its plans to make Bitcoin a legal tender.
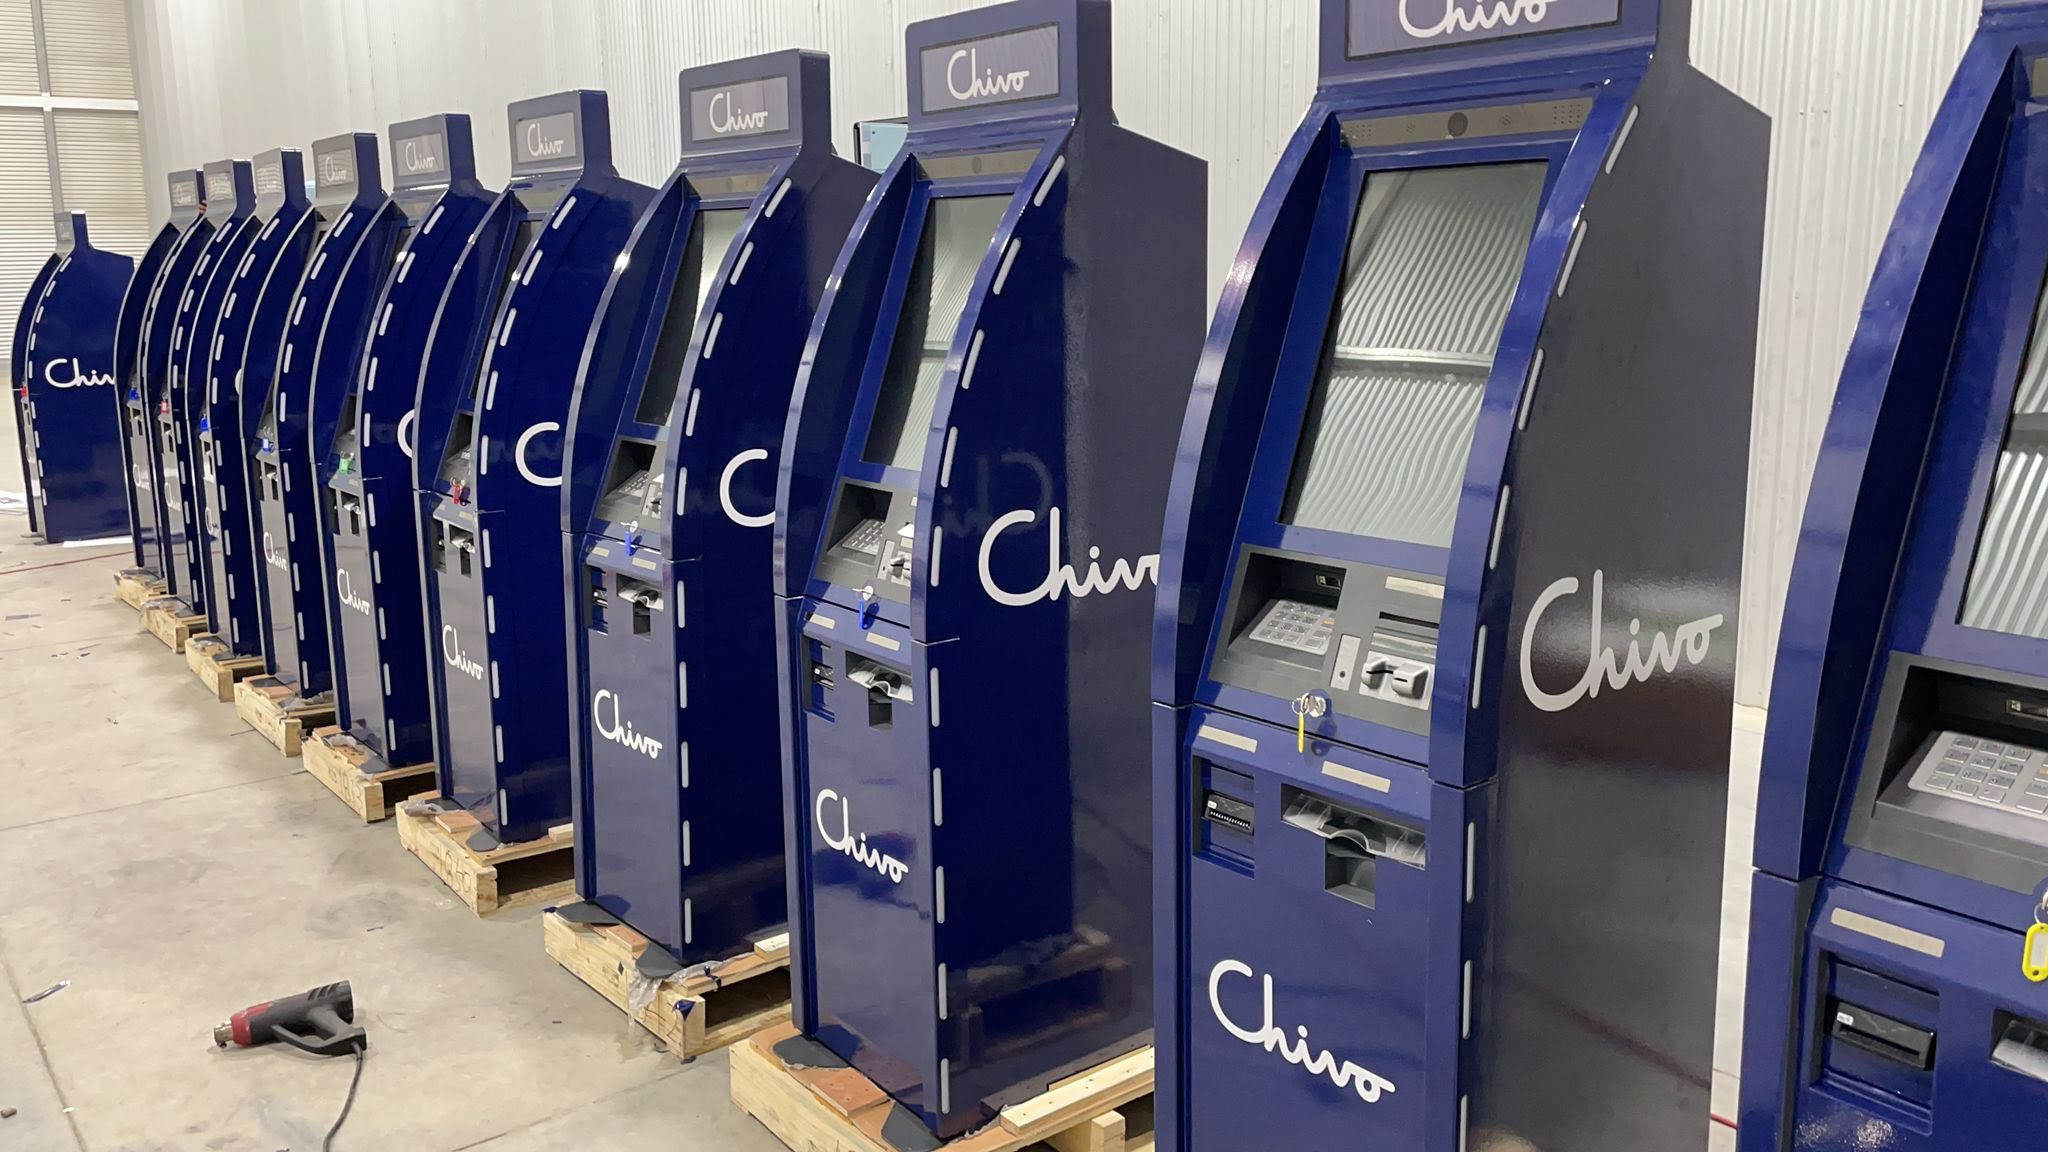
El Salvador’s Bitcoin adoption bill is expected to be implemented in early September 2021, and President Nayib Bukele has promised to grant 30 USD to every citizen. El Salvador also launched its state-backed Bitcoin wallet Chivo compatible with a network of 50 bank branches and 200 ATMs.
El Salvador’s remittances comprised almost $6 billion, approximately a fifth of the country’s GDP. Bukele has maintained his Bitcoin adoption plan to reduce the transaction costs for the country’s 6,5 million citizens and help its significant unbanked population.
BITCOIN’S VALUE PROPOSITION TO INVESTORS
GROWTH
The pioneering blockchain industry is developing at an escalating pace, and new projects are constantly gaining traction. The mass adoption in bitcoin & blockchain tech and tokenization, in general, will continue to evolve rapidly in coming years
DIVERSIFICATION
Bitcoin with a low historical correlation to traditional markets is an emerging asset class to consider as a part of portfolio diversification. Even just 1-5% allocation to bitcoin has been historically impacting portfolio performance favorably.
HEDGE
Bitcoin can be seen as a potential hedge to traditional asset classes. Built-in features like 21 million hard cap, inflation-free structure, and antifragile blockchain make bitcoin a store of value.
DECENTRALIZED VALUE
Global, decentralized, censorship-resistant & programmable asset with a proven 10-year track record, showing tremendous staying power. With 99,98% uptime since inception, every subsequent day online makes bitcoin more robust, secured by a built-in incentive structure
MARKETS & EXCHANGES
MARKET CAPITALIZATION
This year the bitcoin dominance index underwent a true paradigm shift, peaking at 73 percent in early January, the highest Bitcoin dominance % recorded after 2019. However, after early January 2021 and the subsequent market crash, Bitcoin dominance dropped significantly to 40%.
After the May crash, Bitcoin dominance recovered swiftly from 40% level into 50% level. However, it’s still far away from the early 2021 highs. The most plausible explanations for dropping dominance would be Ethereum’s upcoming (PoS) upgrades, the rise of DeFi and NFTs, and overall tightening competition.
The market has been anticipating a possible BTC / ETH market capitalization flippening scenario, and the closest merges so far have been in February 2018 and May 2021. In February 2018, both assets momentarily approached $100 billion MCAP, and they tried to merge again around the $500 billion levels this May. Both occasions have been momentary anomalies, though, coinciding with cycle ends. ETH has under half of BTC’s market cap and would need to ascend 147,78 percent to meet Bitcoin.
FIAT EXCHANGES
Coinbase continued to lead the fiat exchanges with 79,14 billion USD worth of monthly volume, Coinbase additionally leads the exchange in relative market share, dominating 22,44 percent of the traditional fiat exchange market in August. Coinbase’s market share has increased moderately from Q1’s 21,56%. Coinbase had a grandiose initial public offering (IPO) in April as NASDAQ listed Coinbase as ticker: COIN. Initially the COIN stock was trading well above $300, however it has since dropped -19% year-to-date (YTD). COIN currently trades in close proximity to $250 and many would consider it having more upside potential.
The leading Korean exchange Upbit took the second place with 67,55 billion dollars worth of volume. FTX is definitely one of the rising American stars in the traditional exchange industry, rising to 49,77 billion in monthly volume. FTX has been running exceptional marketing campaigns, recently naming a Miami sports and entertainment arena as FTX Arena. FTX was founded by Sam Bankman-Fried who is also behind the DeFi ecosystem Solana (SOL).
CRYPTO-ONLY EXCHANGES
Not surprisingly, Binance continued to lead the crypto-only exchange market with over 615 billion dollars worth of monthly volume. Binance currently dominates the industry with 66,64 percent market share, rising incrementally from early 2021 58,85%. Binance has been facing some headwinds this year though as regulators and financial institutions across countries have questioned its operations and compliance. Binance’s strategy of staying “above” specific regulations seems to be a double-edged sword: Binance has been able to retain its position as the leading global exchange, however it seemingly cannot compete with exchanges that master country-specific (niche) compliance.
EXCHANGE RESERVES
Exchange reserves mirror investor activity with the following logic: During a bull cycle assets are usually withdrawn from exchanges into private wallets and allocated to long-term cold storage. This is especially true in bitcoin’s case. Respectively, in a bear cycle investors move the funds back to exchanges, in order to convert them to fiat currencies, stablecoins, or other digital assets.
- Bullish sentiment: Native units flow back to private wallets for long-term storage.
- Bearish sentiment: Rising number of native units in exchanges. Units will likely be converted to national (fiat) currencies, stablecoins, or other digital assets.
When exploring the embedded chart, we see that exchange bitcoin reserves stayed low, close to 2,4 million unit level from April to May 2021. After May’s crash, the reserves quickly ascended to 2,5M units and above, marking a 100 000 BTC increase. The number of exchange reserves stayed high amid the bearish market environment, however, the setting shifted again in late July by rising bitcoin spot price.
Exchange Ethereum reserves follow a Bitcoin-like trajectory, however, ETH reserves are even in a deeper decline. The exchange Ethereum reserves stayed between 20 and 21 million native units before May’s crash, after which they momentarily increased to 22 million. Ethereum reserves already started to decline in early July and continued to decline with growing ETHUSD.
The Ethereum reserves have been in a secular decline since early June. This trend most likely stems from growing decentralized finance (DeFi) and NFT applications. The escalating number of users are interested in decentralized exchanges, wrapped products, and collectibles, consequently staking their ETH off-exchange. Ethereum investors are also preparing for upcoming ETH 2.0 update and the consequent PoW -> PoS transition. The recent London hard fork additionally made Ethereum more scarce, raising the incentives to save native units in cold storage.
The stablecoin reserves have been growing since spring 2021. In April 2021 the exchange stable coin reserves crossed 10,82 billion USD, rising to 17,41 billion today. Huge stablecoin reserves are bullish for crypto markets as they practically indicate a lot of money waiting on the sidelines.
P2P Market
LOCALBITCOINS
LocalBitcoins, the famous Finnish Bitcoin OTC platform, was founded in 2012 and became as one of the pioneering Bitcoin marketplaces. During its early years it competed with exchanges like Mt. Gox, the biggest global crypto exchange back then. LocalBitcoins had a leading position as the number 1 OTC site for years, escalating to almost $129,54 million in weekly volume. To be precise the 130M million weekly volume occurred during the third week of December, close to the definitive 2017 bull market peak. The bear market consequently lasted till 2019 after which bitcoin’s spot price eventually recovered.
LocalBitcoins’ volume started to decline in 2019. While bitcoin’s spot price reached new highs in December 2020, LocalBitcoins’ volume stayed in $40 million range, a third of 2017’s peak volume. Even when BTCUSD crossed 60 000 level during spring of 2021, LocalBitcoins’ volume data didn’t follow in correlation, instead the volume decreased through the bull market.
In August 2021 LocalBitcoins’ volume was just a shade compared with peak years of 2017 and 2018, currently at 17 million level. It seems that LocalBitcoins wasn’t able to revise its business model as market and compliance environments shifted radically. LocalBitcoins used to be especially strong in Eastern Europe, a market that used to be extremely profitable. However the EE market also turned out to be challenging for tightening compliance. As LocalBitcoins’ weekly volume has dropped to almost 10% of 2017 peak volume, the trend looks challenging. A turnaround is always possible but it likely requires some paradigm shifting changes to their business model.
PAXFUL
Paxful, LocalBitcoins’ main competitor, has completely overtaken LBC this year. Even though both were somewhat equal in terms of volume during early 2021, Paxful has since increased its volume, conquering LocalBitcoin’s market share. Paxful is especially focused on transactions with gift cards, including partners as Amazon, Apple, eBay, and Google. Paxful’s volume has increased across markets with significant presence in North America, where Paxful has historically been well-positioned
DECENTRALIZED FINANCE
Decentralized finance (DeFi) has continued its incremental growth and Dune Analytics estimated DeFi user base to be 3,13 million at the end of second quarter. DeFi’s user base crossed 1 million in December 2020 and has seen strong growth since.
Compared with the traditional centralized financial service sector, DeFi’s main value proposition is to solve the inherent challenges related to the old finance industry. The most notable drawbacks of “old finance” are considered to be single points of failure and control, monopolizing power, and bureaucracy.
UNISWAP
Uniswap has evolved into the de facto trade platform for decentralized finance, reaching third rank in terms of total value locked (TVL) and dominating the decentralized exchange (DEX) competition with 79,6 percent market share.
Uniswap is a relatively new platform, the native UNI token was introduced in September 2020. The main purpose of UNI is to act as a governance token for community involvement and oversight. Uniswap allows UNI holders to vote on project developments that align the course of Uniswap’s future evolution.
Uniswap’s most unique technology lies in an innovation called automated market maker (AMM). AMM is a smart contract managing pools within the Uniswap platform and together they provide tokens used for effectuating a transaction. Uniswap has recently been listed on Coinmotion
NFT MARKET
NFTs, or non-fungible tokens, have made a grand debut this year, evolving into an essential part of the decentralized finance (DeFi) ecosystem. OpenSea, the largest decentralized marketplace for digital goods, is approaching a definitive $1 billion monthly volume. OpenSea allows digital art trading, decentralized domain names, trading cards, virtual ecosystems, collectibles, and NFTs.
OpenSea’s operational model allows anyone to trade NFTs on the platform while taking no custody for any items listed on the site. OpenSea users trade using a smart contract, storing their items in a chosen wallet. OpenSea’s current fee is 2,5 percent of the NFT purchase price.
THREE ARROW CAPITAL LAUNCHES A NFT FUND
Three Arrows Capital, one of the most famous digital asset hedge funds, has launched a NFT-focused fund in co-operation with NFT trader Vincent Van Dough. Three Arrow Cap announced their simple investment thesis that includes gaining exposure to the NFT cultural paradigm shift by acquiring a selection of the most desired sets. The Singapore-based hedge fund has over 20 billion USD in assets under management (AUM) and reportedly holds 37 000 bitcoins via Grayscale’s GBTC.
INDICES
The Bletchley 10 Index is composed of 10 most valuable digital assets, measured in market capitalization. The asset composition of Bletchley 10 increased sharply in price during early months of 2021 and until May’s market correction. Bletchley 10 ascended 206,3 percent between January and May’s peak. The performance was supported by leading digital assets Bitcoin and Ethereum. The ten largest altcoins can be considered as “oscillators”, they oscillate with bitcoin’s performance, making them possibly more alluring to investors.
Bletchley 40 Index, composed of 40 small-sized digital assets, ascended 896,37 percent between January and May peak. The Bletchley 40 Index includes many small-sized ERC and DeFi tokens, which by default have small market caps and are more volatile than larger digital assets.
Bletchley 10 Index: Market cap weighted index composed of 10 of most valuable digital assets by nominal MCAP.
Bletchley 20 Index: Market cap weighted index composed of 20 medium-sized digital assets by nominal MCAP.
Bletchley 40 Index: Market cap weighted index composed of 40 small-sized digital assets by MCAP.
Bletchley Ethereum Token Index: Market cap weighted index of a variable number of assets that are run on the Ethereum platform, mostly ERC-20 protocol tokens.
The market capitalization of each asset in indexes is calculated off of the expected total supply in 2050.
GRAYSCALE
Grayscale’s GBTC and ETHE funds are market-leading financial products for Bitcoin and Ethereum, making them important indicators for the underlying assets. Grayscale is an entity governed by Digital Currency Group (DCG), which launched in 2015. DCG also owns a large selection of bitcoin and crypto-related companies. Mirroring the mass of Grayscale, the company owns 3,12 percent of all bitcoin units (BTC) in circulation, holding 654 600 bitcoins in its reserves. This amount of bitcoin reserves potentially grants great power to the company.
Institutions have heavily used the GBTC and ETHE funds for a so called arbitrage trade that seemingly well until February 2021, and we can argue that many newcomer institutions used this arbitrage opportunity. Just like a typical anomaly, the time window for arbitrage trade closed in February, and GBTC premium shifted negative (discount). The premium-discount event was a massive paradigm shift for GBTC and started to generate selling pressure to the underlying asset (bitcoin). However GBTC and ETHE premiums have been increasing recently with ETHE even reaching a slightly positive premium. Recovering premiums would be a good indicator for Grayscale and the institutional market as whole.