
Coinmotion Quarterly Report Q2 2022
The Great Merge
Table of Contents
THE BEAR
Let’s be honest, Bitcoin just had the worst quarter in a decade as its spot price weakened -58 percent during the second quarter of 2022. The awful performance of Q2 was only exceeded by the third quarter of 2011, in which bitcoin weakened -68%. Nevertheless, bitcoin’s price drop in Q2 was eclipsed by ether, as the native token of the leading decentralised finance platform weakened -69%.
So why have digital assets been suffering so much? The answer lies in multiple factors. First of all, the macro environment is historically challenging and the inflation is off the charts. According to Forbes, Germany’s inflation recently reached the highest level in 70 years. Additionally there’s literally an ongoing war in Europe. These factors combined have made the market environment difficult for almost all asset classes. [1]
While throughout its history Bitcoin has been said to be an “uncorrelated” asset, the definition has been under pressure recently. Actually Bitcoin can be said to be a correlated and uncorrelated asset class at the same time. Like Schrödinger’s cat, it is and is not at the same time.
To understand Bitcoin’s correlation with the main street, we have to go back in time to the early days of the leading digital asset. In its early days, Bitcoin was definitely uncorrelated to any asset class as an relatively illiquid and exotic asset. The correlation with S&P 500 really started to pick up during the “Saylor season” of 2020, as MicroStrategy announced its heavy Bitcoin allocations.
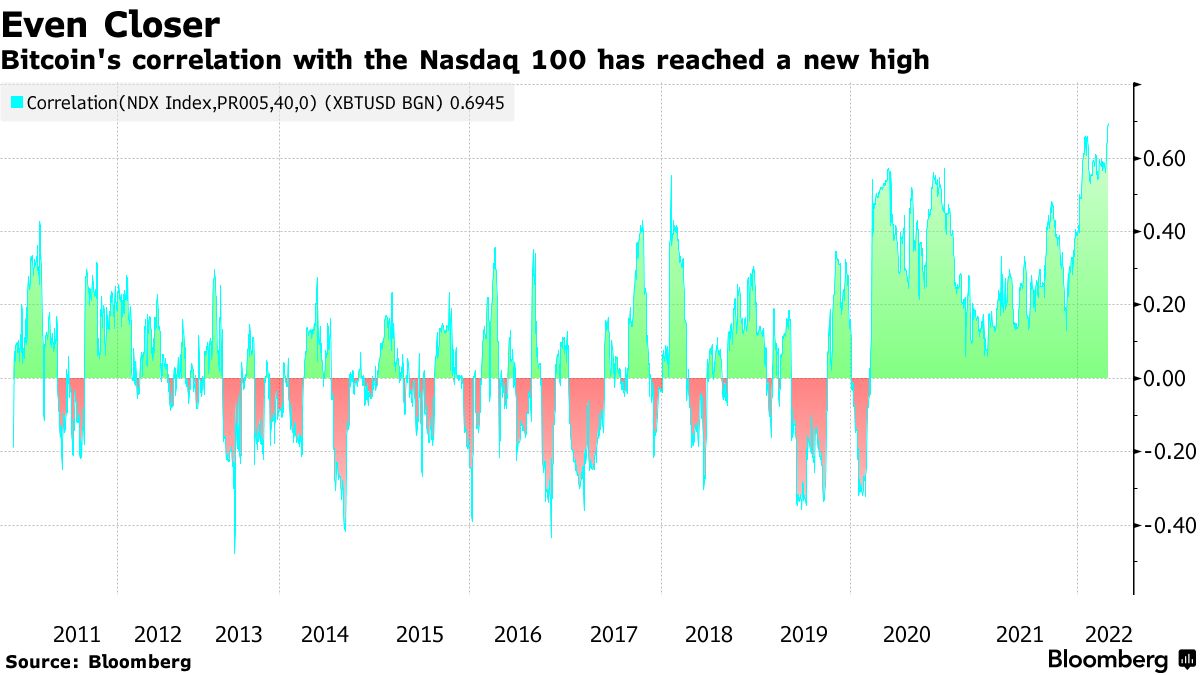
Since then, the correlation has been increasing and in the bear market of 2022, marking a new high on May 13th as the (Pearson, 90D) correlation reached 0,64. This is the highest correlation to the leading stock market index ever. In April 2022, the correlation between Bitcoin and technology stock index Nasdaq 100 reached 0,69, marking an all time high.
As Bitcoin has grown literally from a few million market capitalization into current $430 billion, it also became more mainstream as a byproduct. Investors are considering Bitcoin as a high beta asset and placing it into the same category with high technology stocks. This may not be a bad thing as Bitcoin’s huge price appreciation would not have been possible without it becoming “mainstream”.
Despite all this, Bitcoin’s effect on humanity has been phenomenal. As Coinbase’s Brian Armstrong recently said: “Economic freedom is good for the world. Property rights, sound money, reducing friction, etc, has led to enormous prosperity. Crypto is the best invention we have to enable this globally.” [2]
MARKET CORRECTION AND NEW HOPE
While the first half (H1) of 2022 has been brutal for digital assets, the past two months have been filled with hope. Digital assets often face the crushing macro-level selling pressure first, however they also bounce stronger than the main street after bottom has been reached.
Most higher beta risk assets found their market bottom between June 16th and 18th. Even with the news of many overleveraged institutions, bitcoin and ether still have outperformed equities since their lows. At the end of Q2, bitcoin was up 28 percent from lows, while ether was up 78%. As a reference, Nasdaq Composite only corrected 11% upwards by the end of Q2.
Indexed Price Performance after Market Correction
Sources: Coin Metrics, Bloomberg
No Data Found
Bitcoin and Ethereum have remained exceptionally strong amid the macro uncertainties and this robustness is a positive indicator regarding the future. Ethereum is particularly supported by investors trying to price in the September merge.
H1 Returns by Asset Class
Source: Bloomberg
No Data Found
As the embedded chart shows, commodities and gold were the rare winners in the first half of 2022. Commodities were pulled up by inflation and supply shock issues generated by geopolitics and COVID-19. The market closely follows the behaviour of the dollar index DXY, which recently broke its parabolic advance. DXY managed to climb 13 percent between early January and trend reversal. If DXY’s decline proceeds further, it gives the cryptocurrencies some long-awaited leeway.
BENCHMARKING THE MARKET CYCLES
Bitcoin’s spot price has now decreased -65 percent from November 2021 cycle top and many analysts consider the $19K confluence level to be a heavy support. Coinmotion Research has stacked indexed data from previous market cycles and compared them with the current drawdown.
The bear market of 2011 was most brutal by this date, including bitcoin’s spot price drop from June’s $29 to November’s $2. The bear market of Bitcoin’s early days eventually took the asset down -92,75 percent. The market cycle of 2013-2014 was phenomenal as Bitcoin climbed parabolically 8414% from $13 to $1135. However the subsequent bear cycle was equally massive and propelled Bitcoin into a -84,52% dive. In the last bear market, bitcoin dropped -83,78% from late 2017 peak to 2018-2019 bottom.
Bitcoin Market Cycles and Spot Price Drawdowns
Sources: Coinmotion Research, Coin Metrics
No Data Found
If we benchmark the current market cycle against the 2017-2018 cycle, bitcoin would still need to drop -59% in order to reach -83,78%. A hypothetical -59% decrease from $21K level would drop bitcoin into $8610, which would definitely reset the whole market. In my opinion, a -59% drop is unlikely and bitcoin would more likely continue its moderate upward trajectory.
GROWTH DESPITE THE ODDS
Although Bitcoin has seen a significant market correction during spring 2022, the annual low prices are in an upward trajectory. Amid the falling spot prices, the yearly lows are a great way to get a different vantage point on the long-term price action.
Bitcoin’s current yearly low setting closely resembles the structure in 2014 and 2015, when yearly low dropped from $284 to $183. From 2014 to 2015 lows, the spot price decreased -36 percent. In the current correction, the spot price lows dropped -36% from $29 251 to $19 041.
Bitcoin: Annual Low Price (USD)
Source: Bloomberg
No Data Found
Compared with the low of 2020, this year’s price bottom is 288 percent higher. Amid the increasingly volatile macro markets, Bitcoin investors should remember to keep a long-term view. The yearly low chart removes much of the noise from the big picture.
Bitcoin: The Growth of Annual Transfer Volume (Y/Y)
Source: Glassnode
No Data Found
Bitcoin’s growth of annual transfer volume has been increasing despite the bearish sentiment. The year-on-year transfer volume is currently up 36 percent from last year, while from 2020 to 2021 the transfer volume increased 463%.
The largest yearly transfer volume hike so far happened between 2016 and 2017, when the volume increased 1035 percent. The transfer volume mirrors Bitcoin’s robust fundamentals despite the momentary weakness in price action.


ETHEREUM’S UPCOMING MERGE
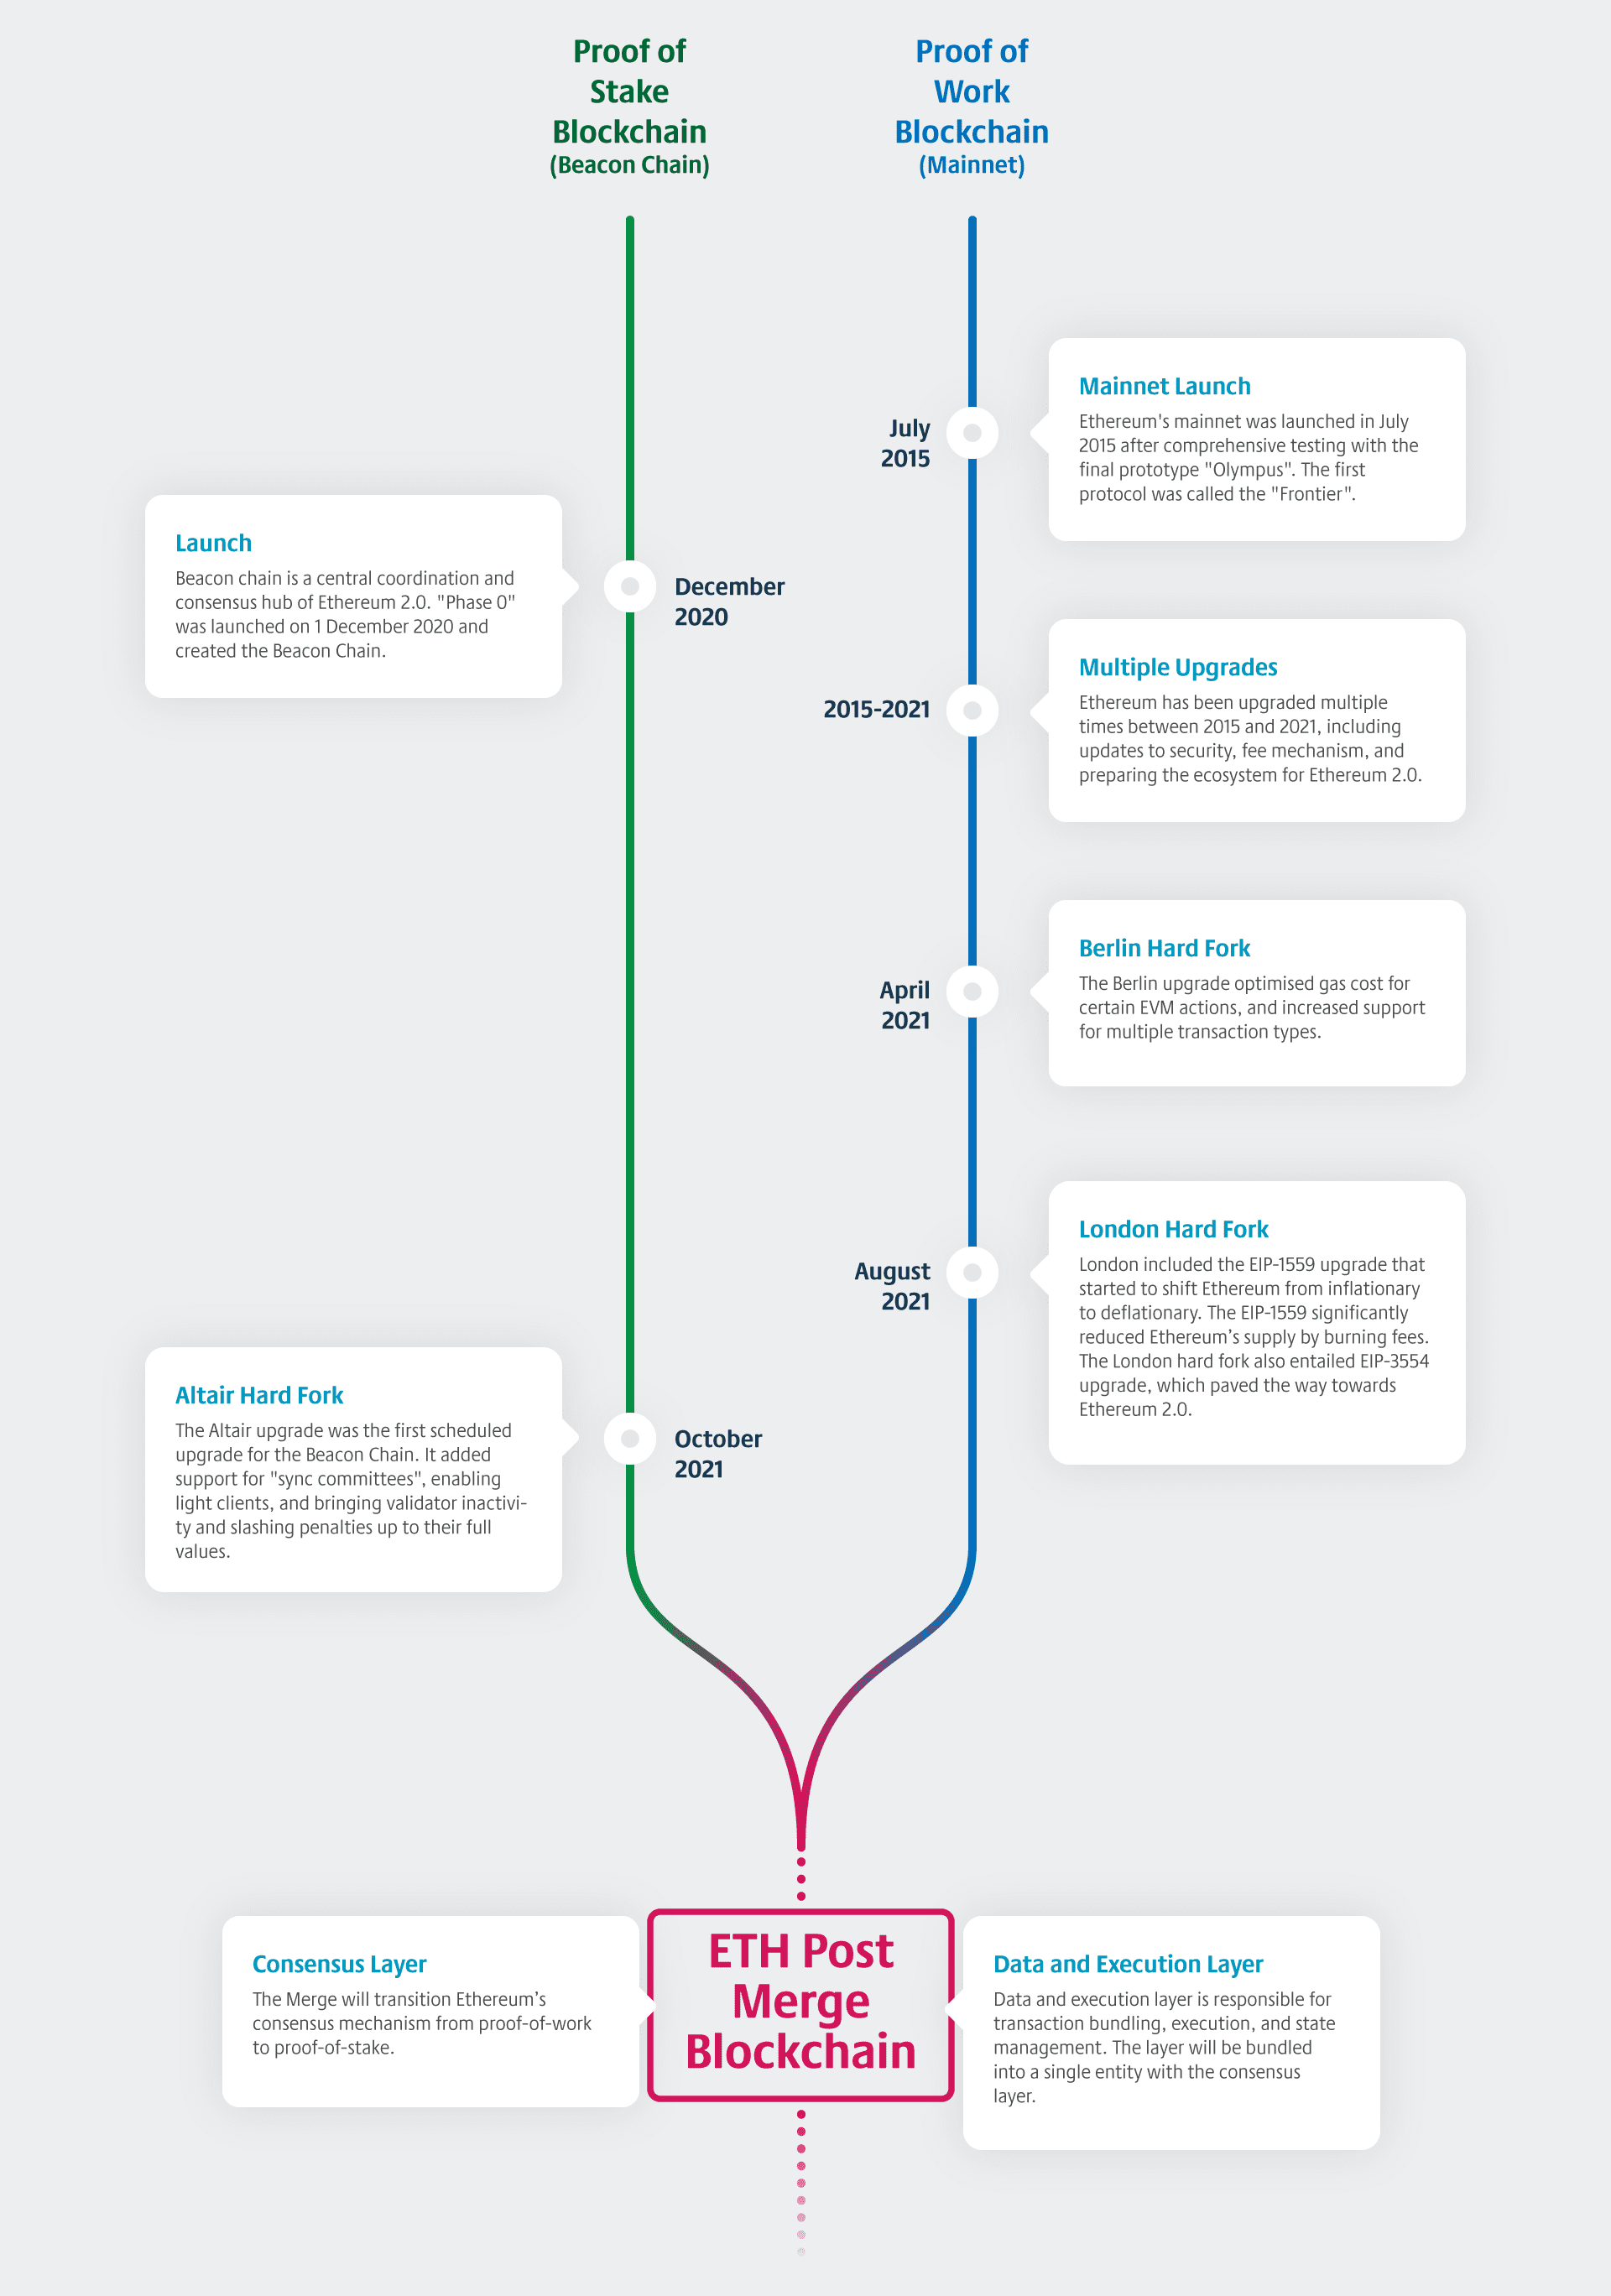
As the bear market has probably been discussed ad nauseam, it’s good to move into more positive topics. Arguably the leading positive event for the crypto industry in 2022 will be the merge, which means Ethereum’s protocol level shift from proof-of-work to proof-of-stake.
In the merge, the existing execution layer (Ethereum mainnet) will merge with the new PoS consensus layer (beacon chain). The network will be secured by staked ETH instead of mining, reducing energy consumption by ~99,95 percent and positioning the blockchain for future scaling upgrades like sharding.
The main selling point of the merge will be the classification of Ethereum as a “green” and “ESG friendly” blockchain. Wealth managers are increasingly aware of ESG-related topics and significantly lower energy consumption would make Ethereum easier to sell to investors. The green narrative would also allow Ethereum to differentiate itself from PoW-based Bitcoin. Many smaller “Ethereum killers”, like Avalanche, already use Proof of Stake.
In essence, the merge promises the fees to remain the same, as the blockspace will not undergo any changes. However, the fees might rise alongside the demand. Ethereum’s supply has previously been inflationary (purple), as the embedded chart shows, and it’s expected to peak at 120,1 million Ether units. The EIP-1559 has been burning Ethereum’s fees since August 2021, effectively making the supply more scarce. Now Ethereum is expected to shift from inflationary to deflationary, as the supply curve (black) turns down. Some analysts even expect Ethereum to enter a virtuous deflationary cycle.
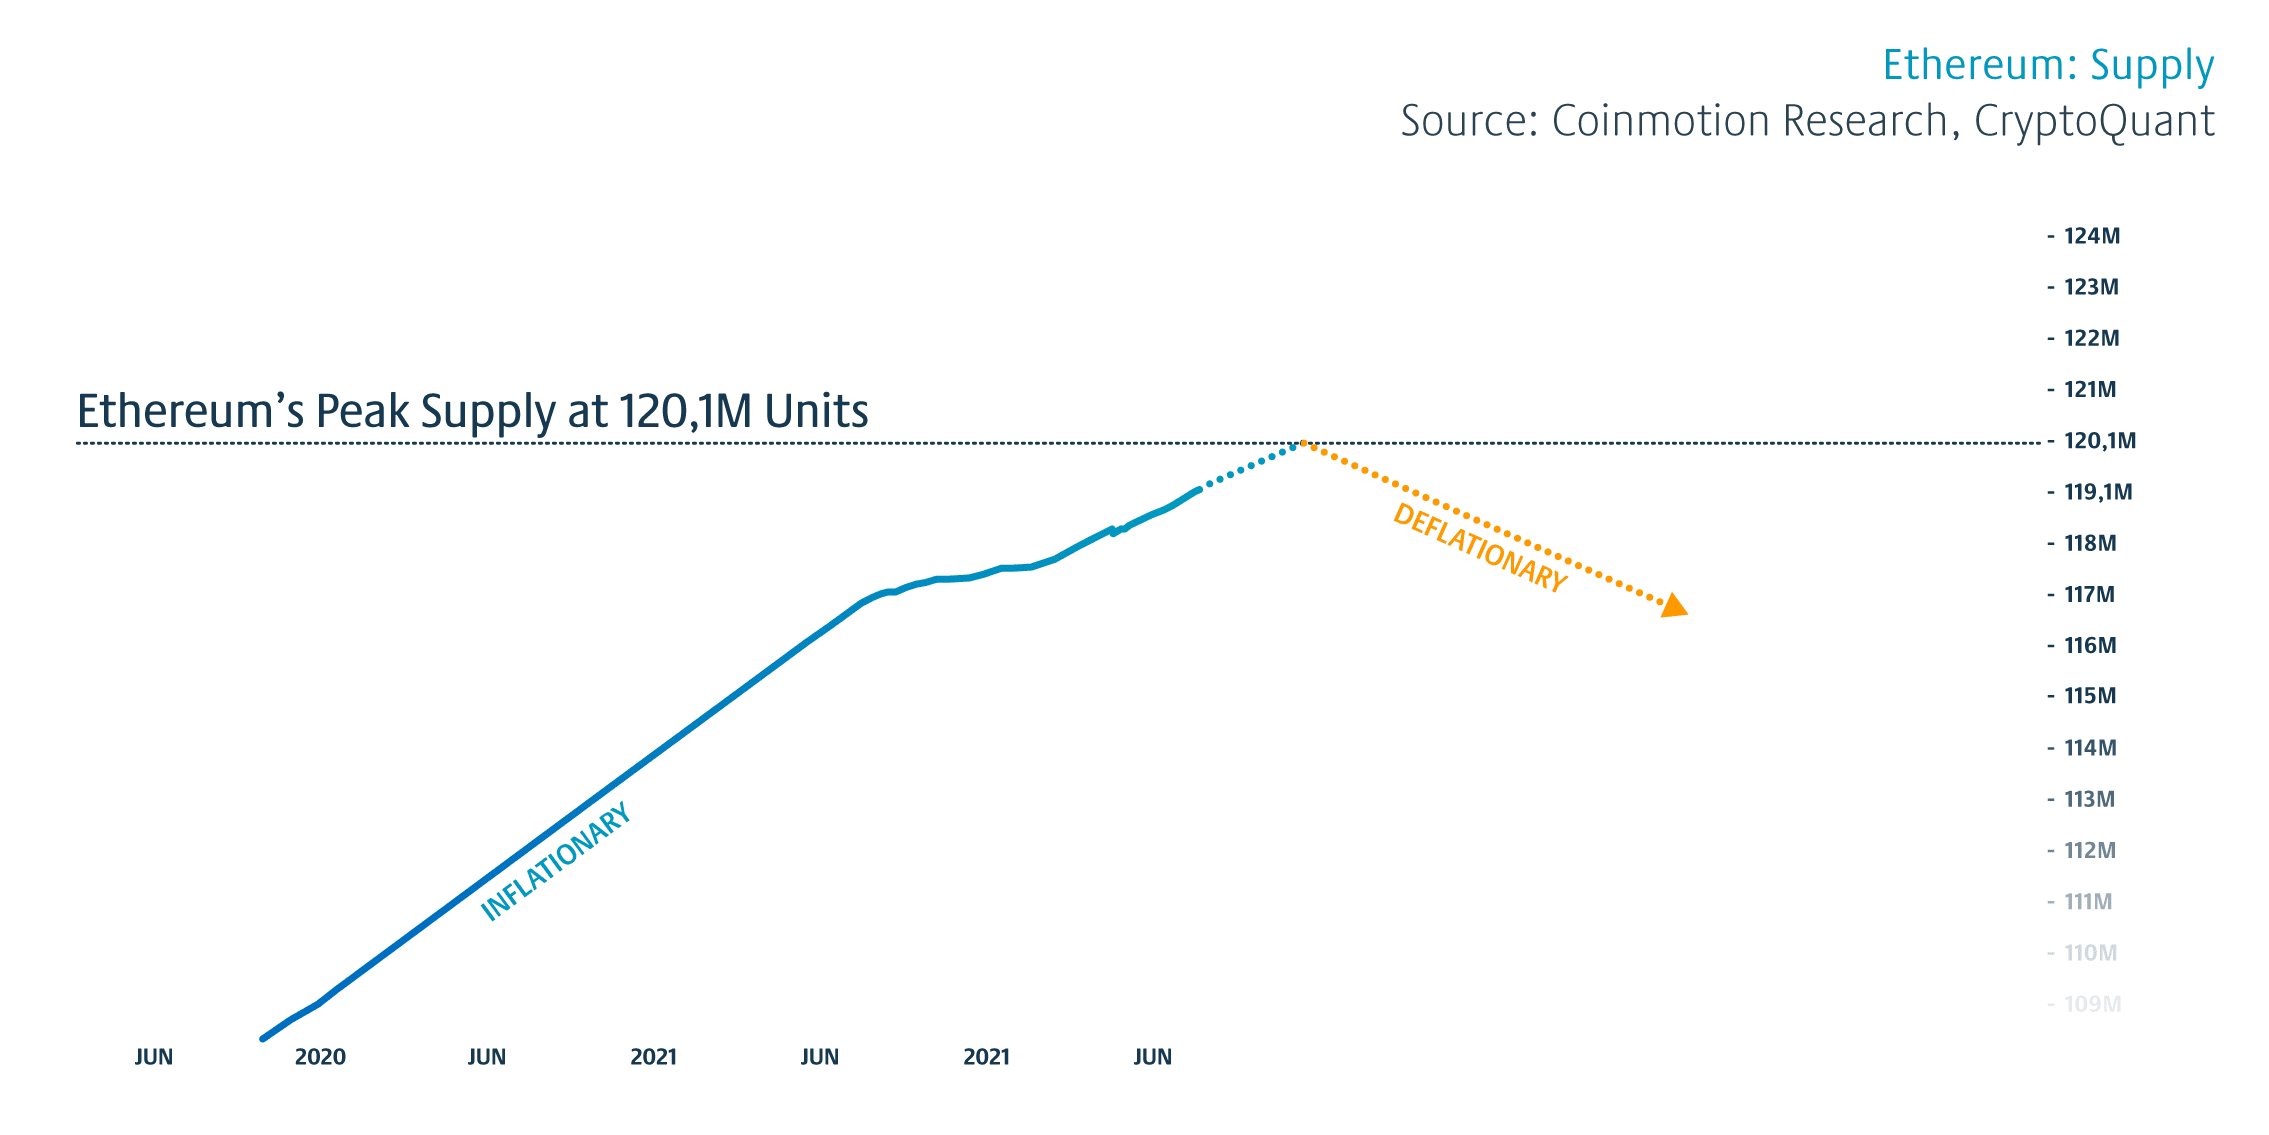
Although “ultra-sound money” may sound like a meme and was possibly created as a marketing term, it correctly mirrors the ongoing change that makes Ethereum scarce and even deflationary in the future. After the 119,3 million native unit peak, the supply horizon is expected to decrease gradually.
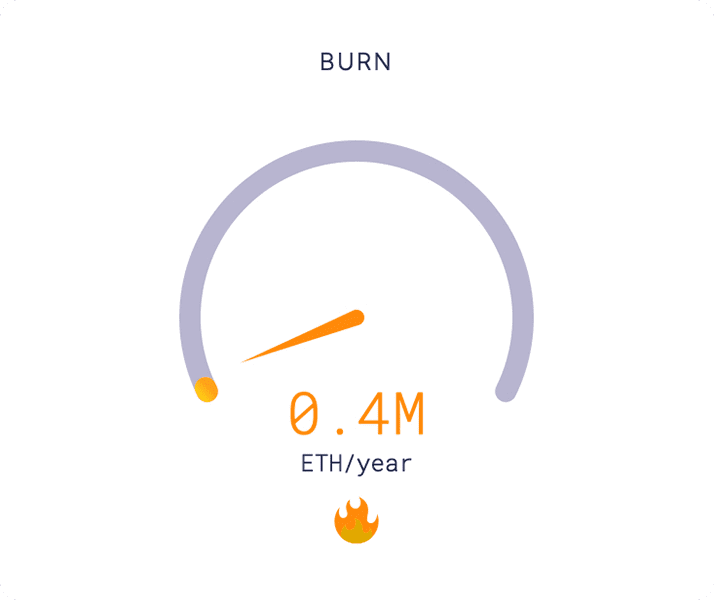
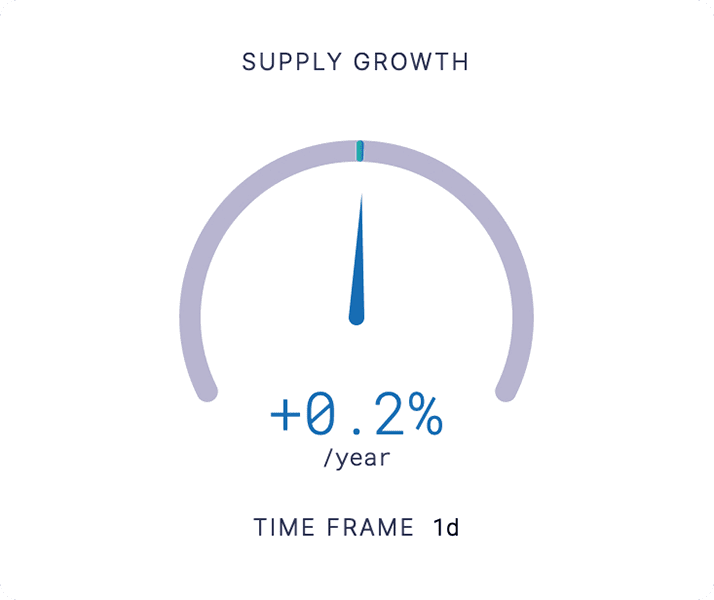
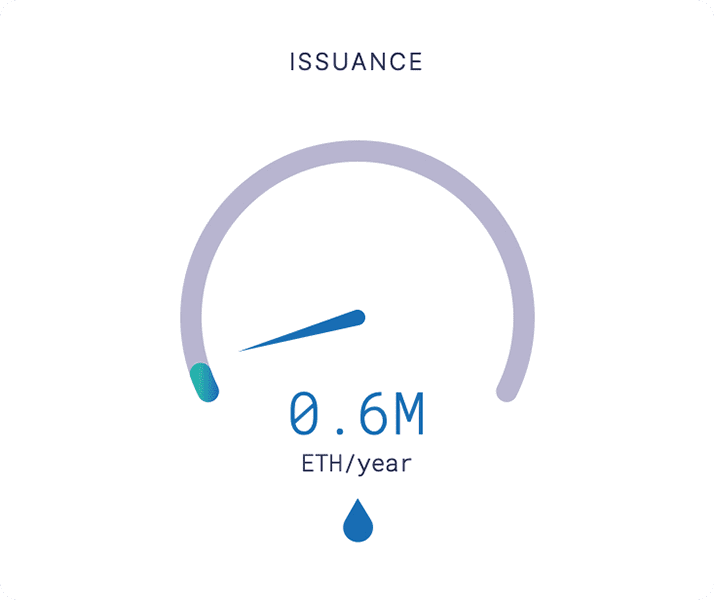
The merge data site ultrasound.money offers a wide set of tools for examining the upcoming protocol shift. While Ethereum’s supply is currently growing at 4,1 percent per year, the growth will drop to a mere 0,2% per annum after a simulated merge. Moreover the current rate of issuance is 5,5 million Ether units yearly and a simulated merge shows the issuance collapsing to 0,6 million per year. [3]
A PROTOCOL-LEVEL CIVIL WAR AHEAD?
As Ethereum has been mined with Proof of Work (PoW) consensus mechanism since 2015, there’s a huge community of retail and institutional miners still running the operations. The combined Ethereum miner revenue peaked at 2,3 billion dollars in may 2021. Because the shift to PoS effectively means the end of mining, there’s a growing revolt among miners. The miner revolution is currently being managed by Chinese Chandler Guo. [4]
The potential revolution would mean the continuation of the PoW-based Ethereum and it has already received support from exchanges. Poloniex, and its leader Justin Sun, recently announced the listing of ETHW (PoW) and ETHS (PoS) tokens. Justin Sun later remarked having one million ether tokens and revealed his intentions to donate some of them to the ETHW community. Later the Seychelles-based exchange Huobi additionally signaled support for the ETHW. The ETHW party was joined yesterday by derivatives exchange BitMEX, which announced a new ETHPOW futures contract. [5]
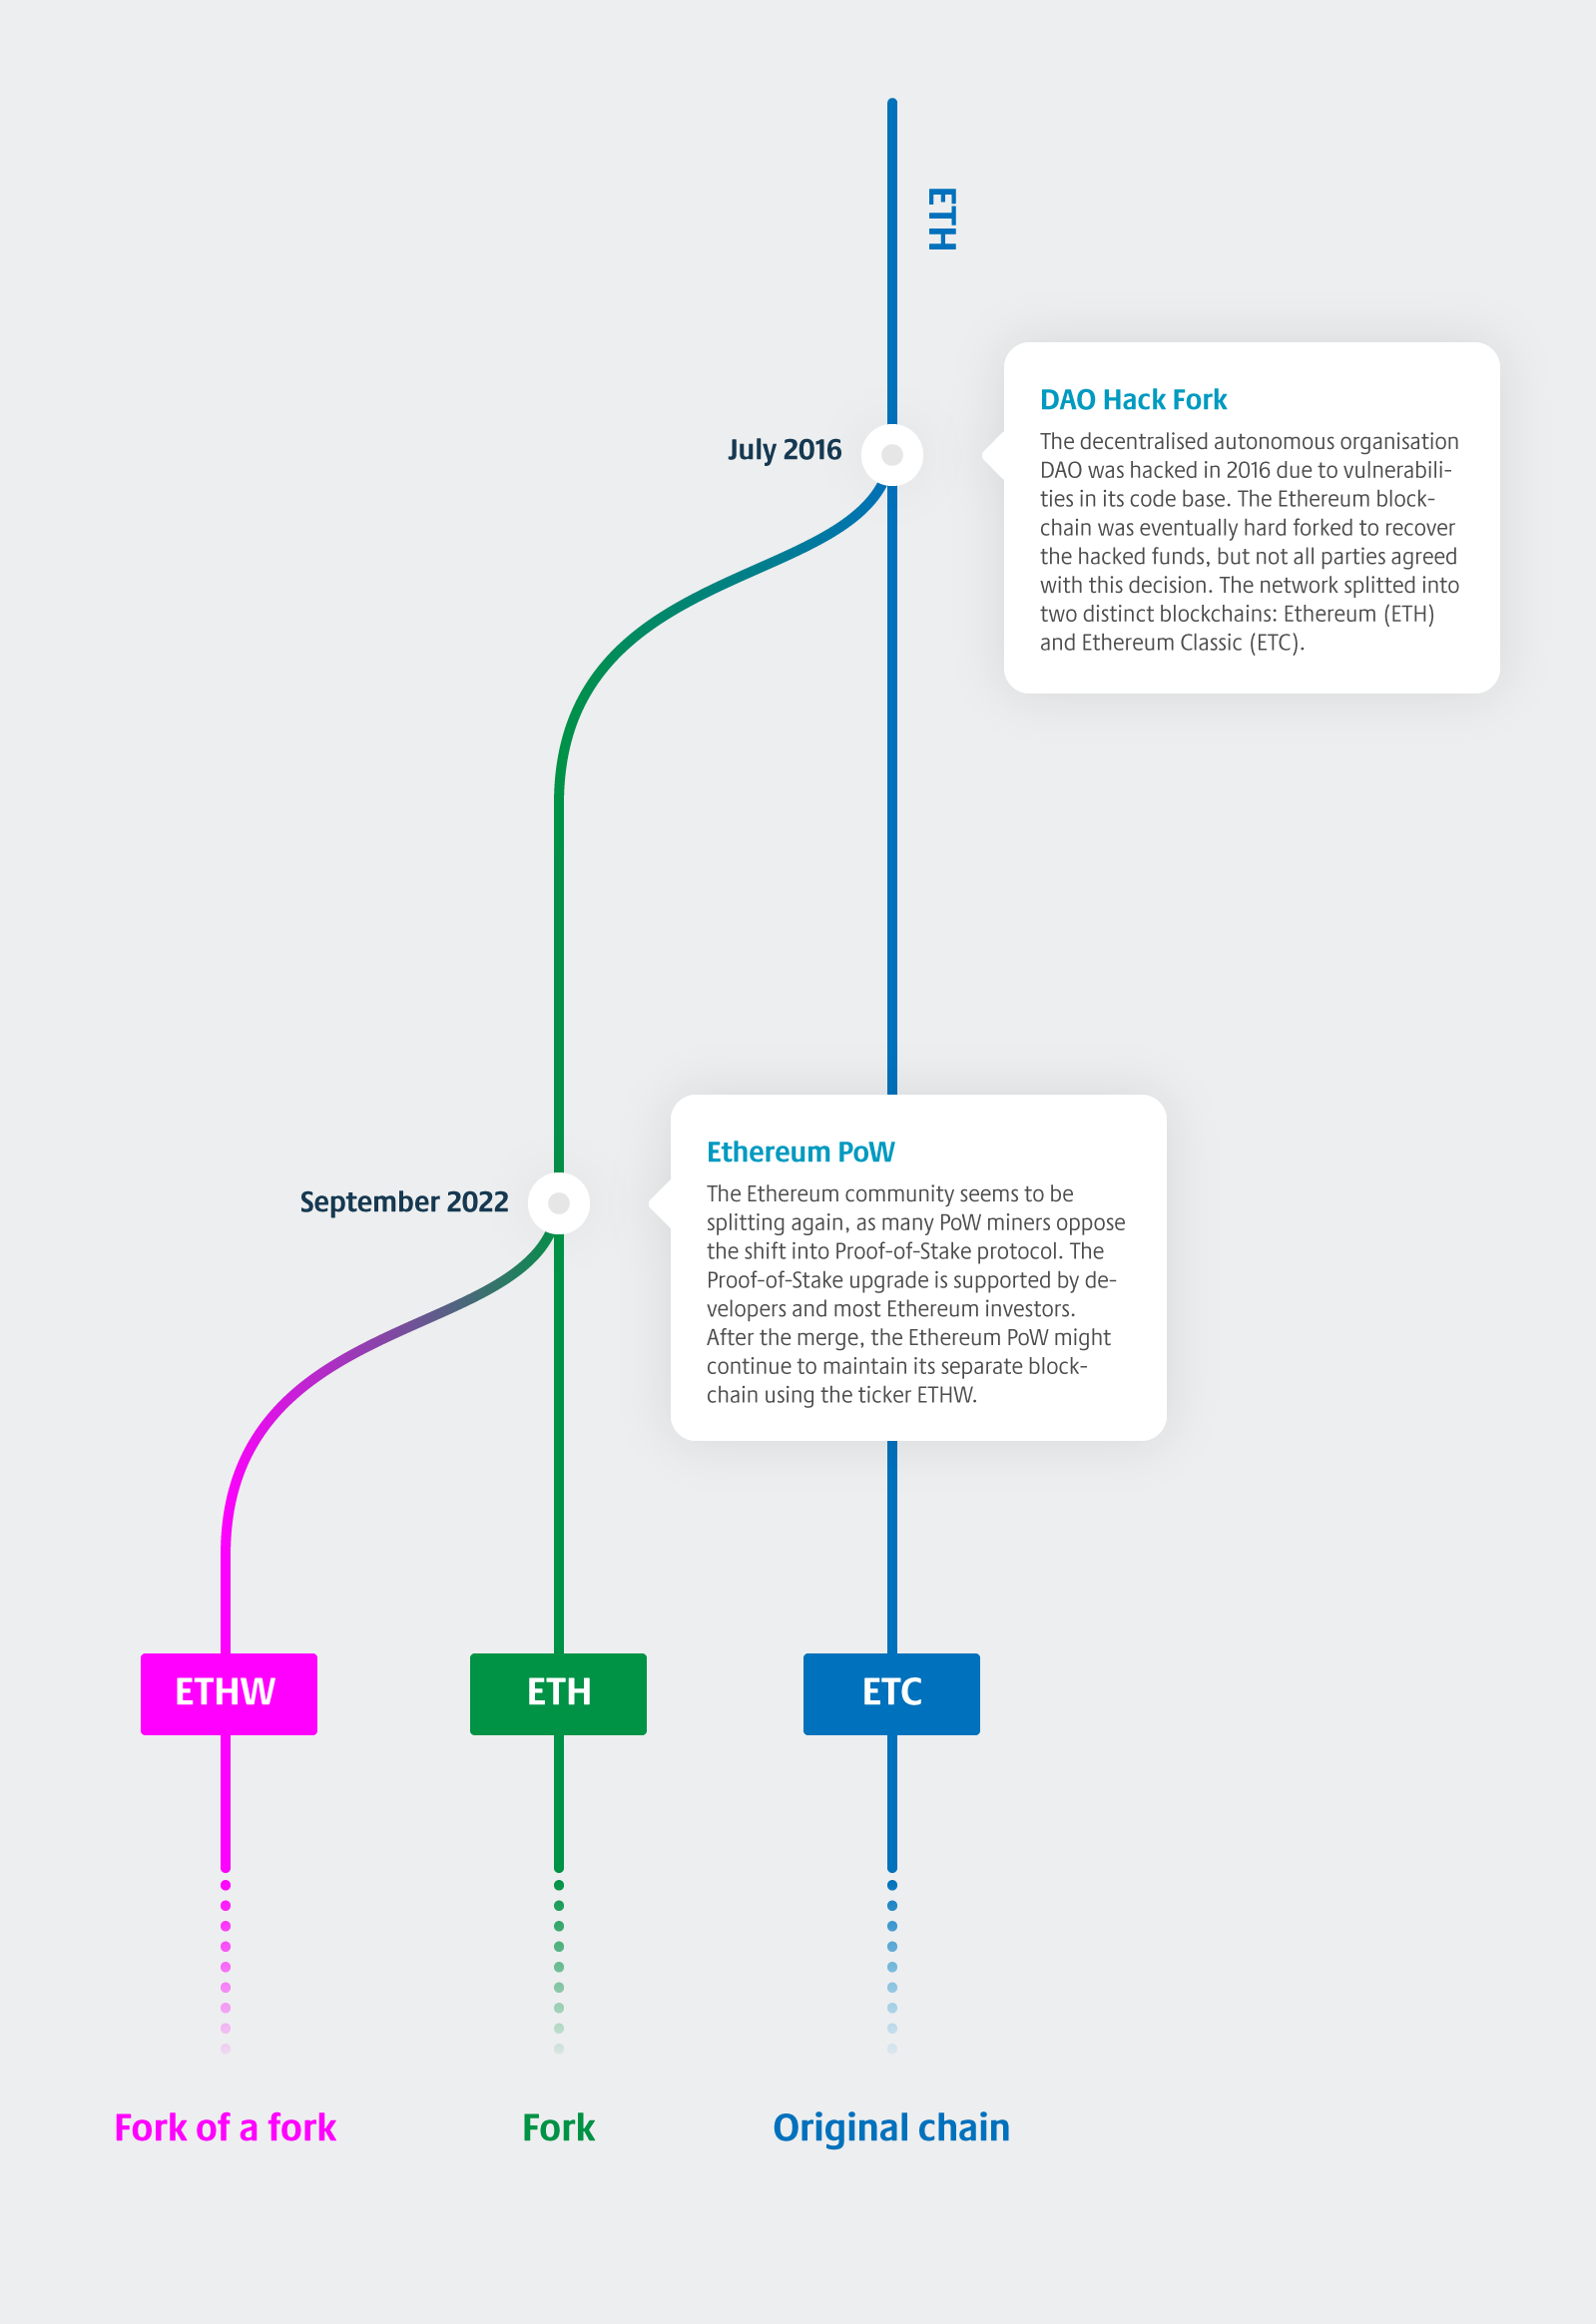
To make things even more interesting, the ETHW would be considered more as a “fork of a fork”. If we’re being precise, Ethereum Classic (ETC) is the original immutable chain of Ethereum, and the longest continuous chain since 2015. The current Ethereum was forked from the original chain in July 2016, following the infamous DAO hack. The potential upcoming ETHW will be forked from the ETH chain, which itself is a fork of ETC.
While the idea of a fork is fascinating, many analysts are still expressing concerns over its eventual viability. The current Ethereum community is strong and most of the participants support the Proof of Stake protocol. While the ETHW could be a great speculative trade, its launch would probably be rocky. ETHW should expect attacks from the ETHS camp in the form of shorting and dumping the ETHW tokens. When the 2016 ETH fork was considered as “peaceful”, I’d expect the ETHS / ETHW setting to be much more hostile. The stakes are now higher.
INVESTOR SEGMENTS
Bitcoin’s investor base consists of multiple cohorts, however the most simple option is to divide investors into short and long term groups. When we look back at bitcoin’s historical spot price data, the leading cryptocurrency has heavily favoured long term investors. Let’s say you bought some bitcoin in the spring of 2016, your investment is still up 6400 percent, despite the recent price correction.
The SOPR indicator, originally created by Renato Shirakashi, is calculated by dividing the realised value (USD) by the value at creation of the output. SOPR indicator is usually divided into Short-Term Holder SOPR (STH-SOPR), and Long-Term Holder SOPR (LTH-SOPR), indicating if long and short term investors are at profit or loss. Or more simply: Price sold divided by price paid. SOPR indicator can be interpreted by following logic:
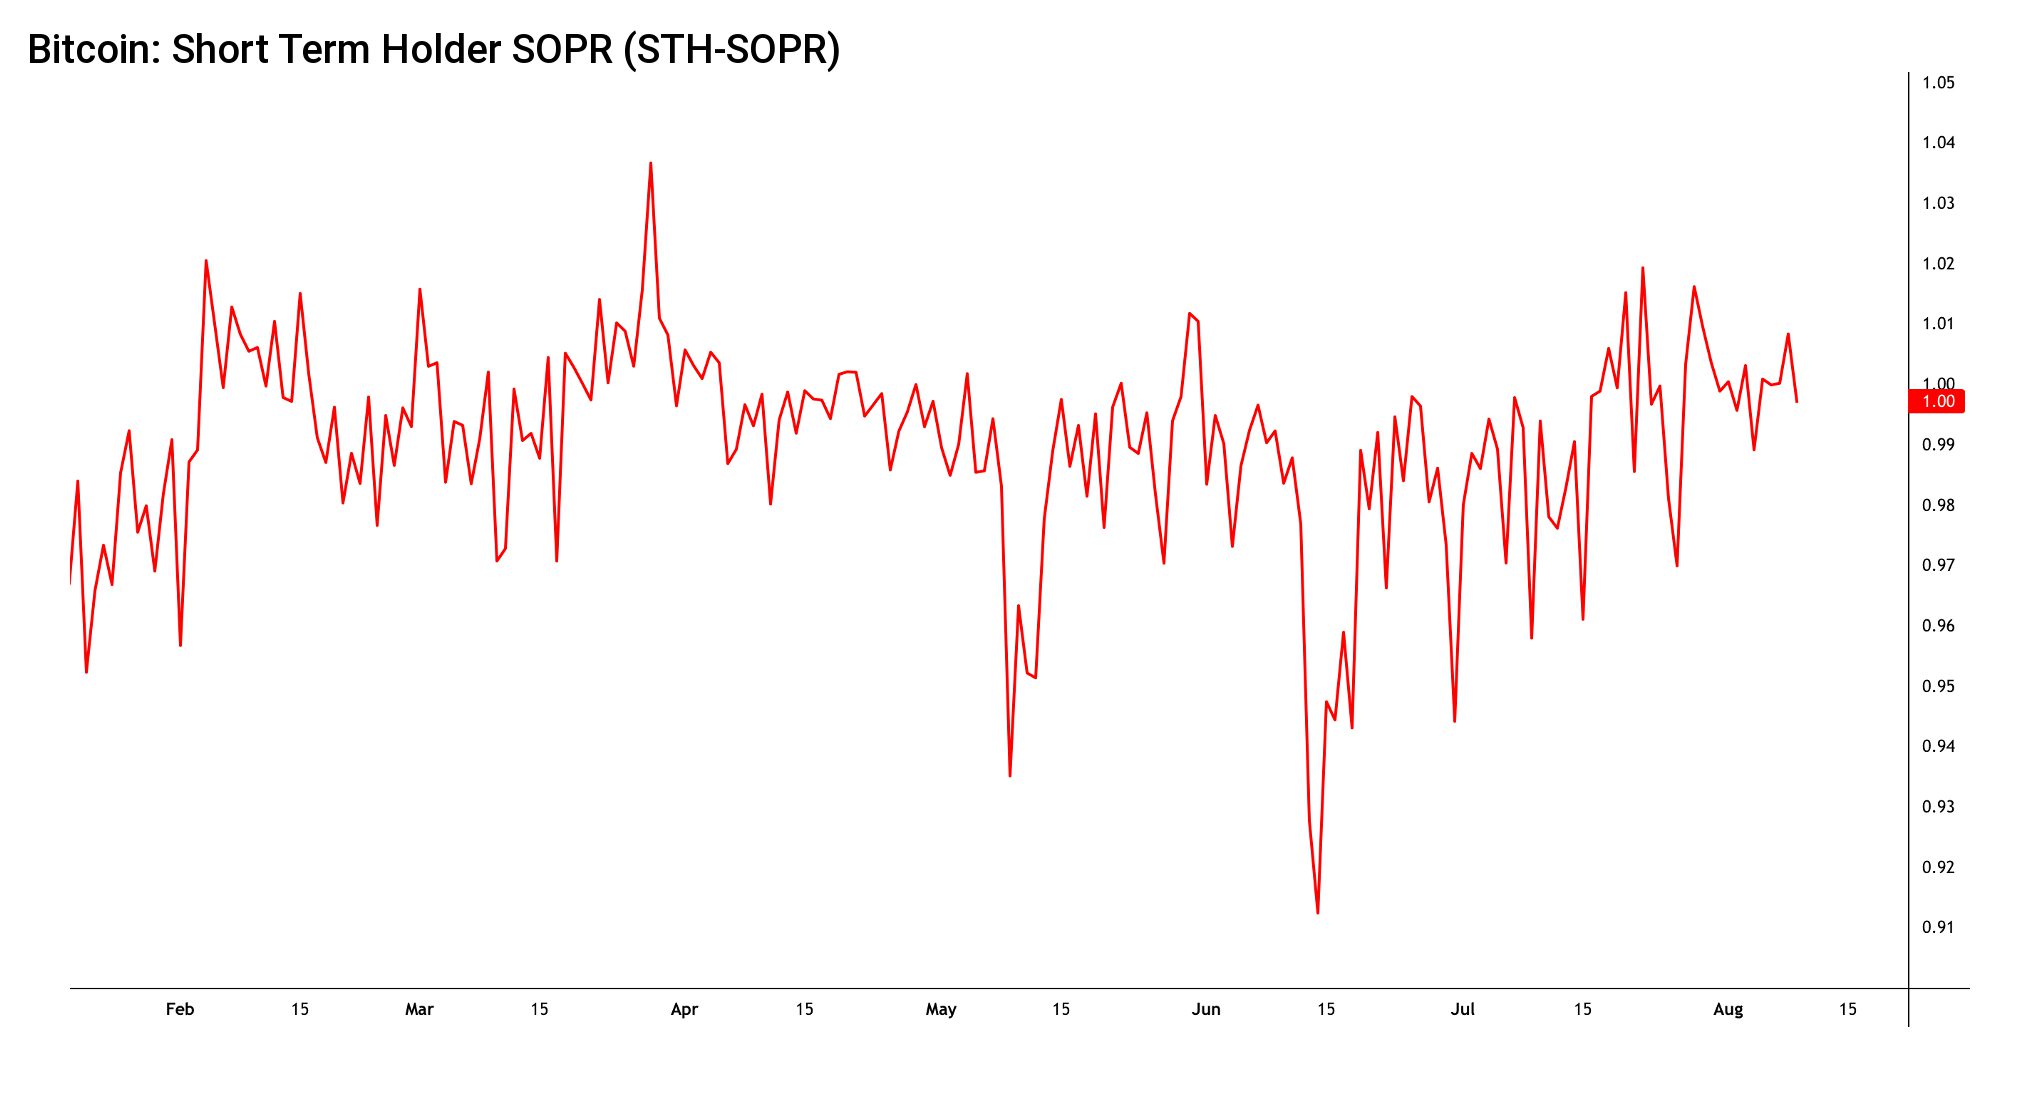
The SOPR can be divided into short term (STH-SOPR) and long term (LTH-SOPR) indicators, each mirroring the profitability of each time preference. A quick glance at short term holder SOPR tells us how the indicator has trickled well below the value of one (1), mirroring heavy losses during summer of 2022.
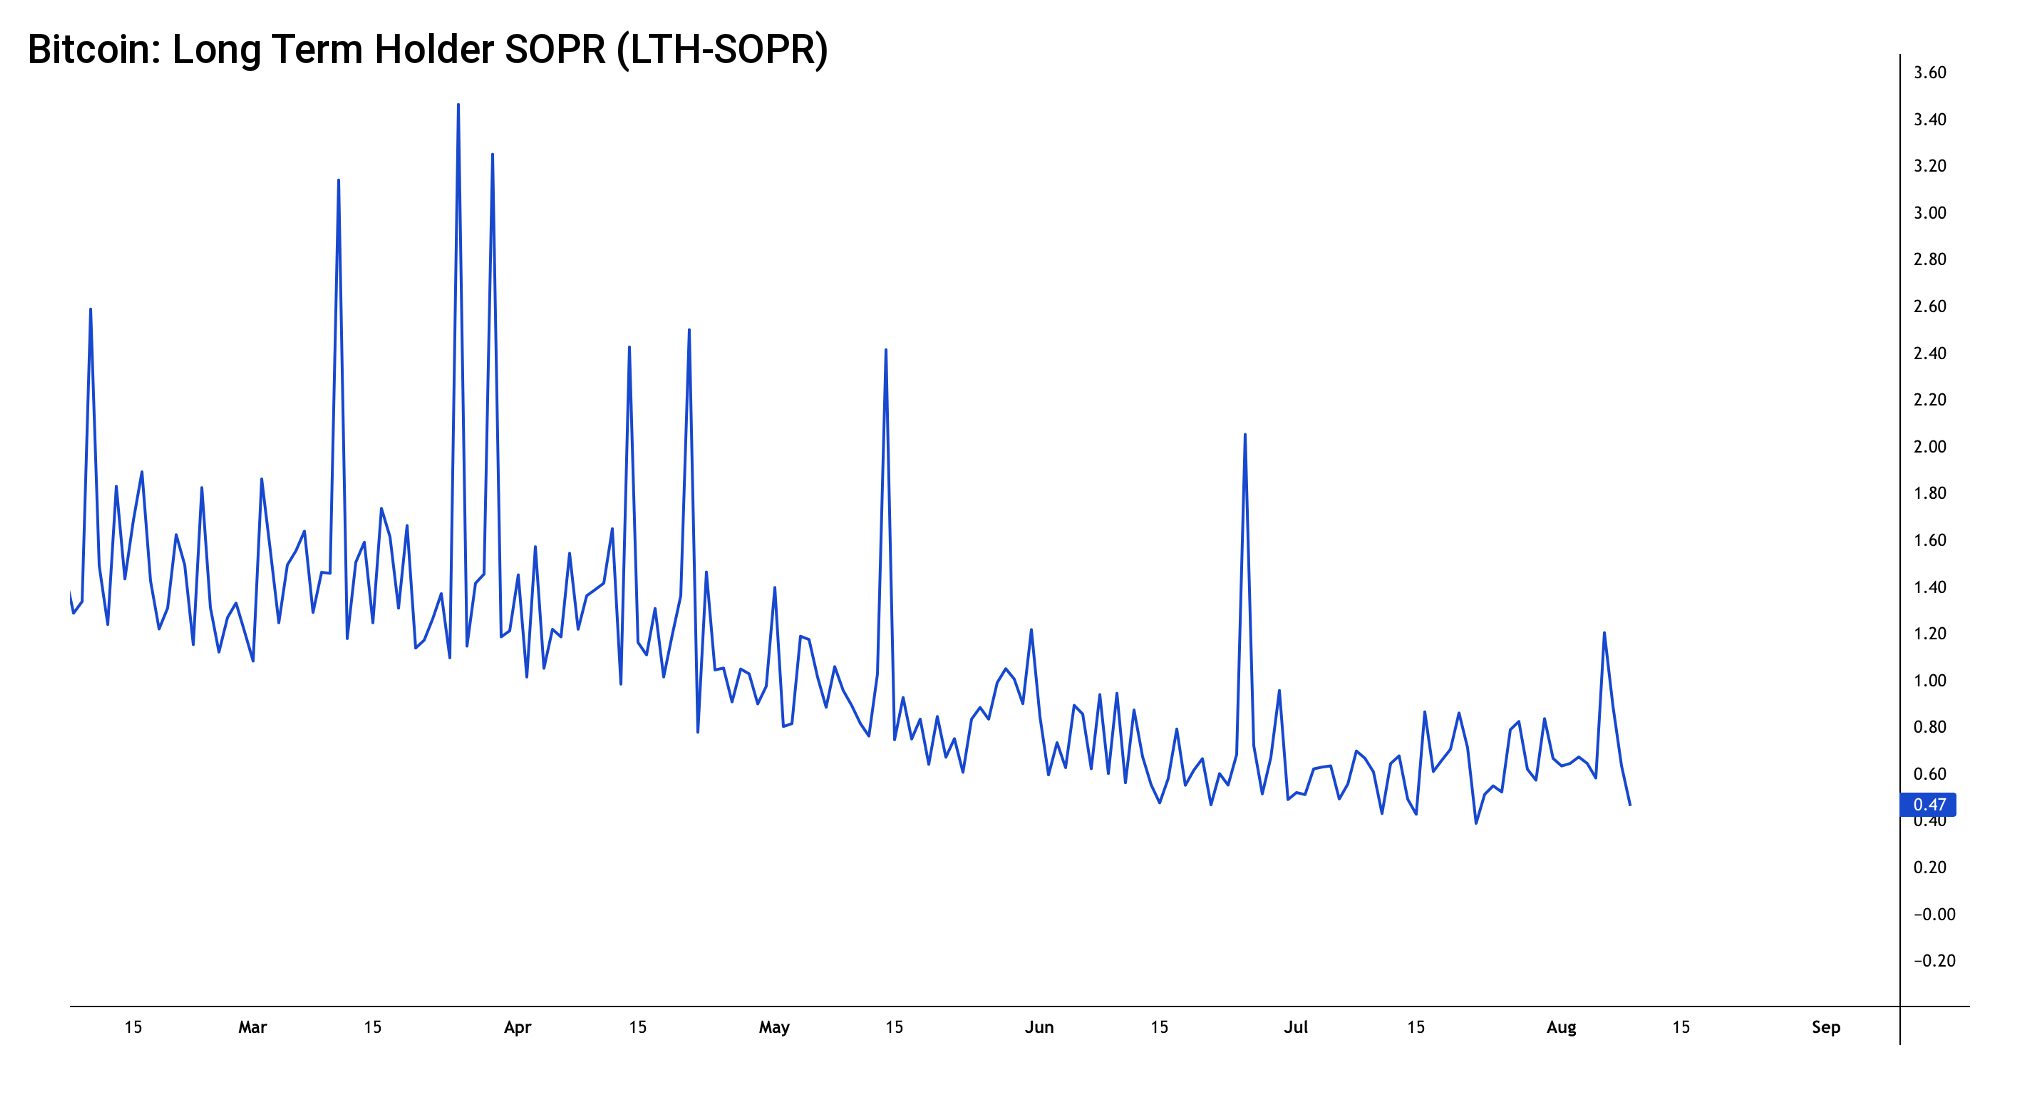
The long term holder SOPR (LTH-SOPR) carries a much more positive narrative. The embedded chart shows how LTH-SOPR has mainly oscillated between the values of one and 3,5 since March, indicating long term investors mainly remaining in profit. Only very recently the LTH-SOPR dropped under one, signaling investor losses and a probable market bottom.
WHALES
The crypto asset markets are heavily influenced by whales, who by the common definition own at least 1000 native bitcoin units. Whales are known to make smart entries and exits compared with the retail investor segment and many analysts try to interpret their behavior.
Whales have a tendency to front-run markets and their behavior in 2022 shows a somewhat surprising risk-on move during the early spring. The amount of bitcoin units in whale-level addresses grew from 7,9 million level into 8,1 million. The whale reserves stayed steady until a risk-off move was implemented in June, reducing the amount of units bacck to 7,9 million level. While during previous years the whales have been able to time the market perfectly, June’s de-risking seems to be a little late.
Value in Addresses with Balance ≥ 1K Native Units
Source: Coin Metrics
No Data Found
If we assume that old rules still apply, the whales could be launching a new risk-on trade around these levels, accumulating cheap coins before retail.
BITCOIN HODL WAVES (UTXO AGE DISTRIBUTION)
Satoshi Nakamoto originally designed Bitcoin as a transparent network. The transparency allows researchers to deeply explore the network and its UTXO structure. UTXO Age Distribution, or more commonly known as “HODL Waves”, presents a macro view of Bitcoin investor behaviour. The UTXO data can be analyzed by dividing the HODL Waves into seven segments. [6]
Bitcoin UTXO Age Distribution
Source: Coin Metrics
No Data Found
The 10 year wave has been going sideways for years, showing no significant change in ultra long-term investors behavior. The medium range waves, like 2 year active supply, are showing some accumulation since early 2022. However the 1 year wave shows how shorter term investors have reduced their risk exposure. Somewhat surprisingly, the 180 day active supply wave shows positive accumulation, mirroring the retail segment buying the dip.
BITCOIN DOMINANCE
Bitcoin’s dominance has been one of the most essential market indicators, as it mirrors the relationship of the leading cryptocurrency and its alternatives. The dominance is calculated by dividing the market capitalization of Bitcoin by the total market cap of all cryptocurrencies.
Bitcoin & Altcoin MCAPs (SINCE 2019)
Sources: Coinmotion Research, Coin Metrics
No Data Found
Bitcoin & Altcoin MCAPs (Last quarter)
Sources: Coinmotion Research, Coin Metrics
No Data Found
Bitcoin’s dominance has undergone huge shifts along the years. The recent years can be divided into epochs of high and low dominance. The season of high Bitcoin dominance spanned from mid-2019 to early 2021. The high Bitcoin dominance season was characterised by low spot price action and bearish sentiment. During the “high season”, Bitcoin’s dominance climbed from 50 percent level to well above 70%.
BTC DOMINANCE (SINCE 2019)
Sources: Coinmotion Research, Coin Metrics
No Data Found
The season of low Bitcoin dominance was inversely correlated with climbing valuations and the inflow of new tokens during the “DeFi summer” of 2020 triggered the dominance crash. Consequently Bitcoin’s dominance fell from >70% to current 30%-40% range. Ethereum’s upcoming merge might further reduce the dominance.
MACRO CORRELATIONS
Bitcoin has been significantly correlated with the stock market and the 90-day Pearson correlation with the leading stock market index S&P 500 (green) increased to 0,64 in mid-May. Historically Bitcoin has been said to be an uncorrelated asset class, however since the “Saylor season” of 2020 the correlation to main street has been more significant.
It seems that investors are increasingly classifying Bitcoin as a high beta technology asset. This was getting more obvious when Bitcoin’s correlation to tech-related Nasdaq 100 index grew to 0,89 this spring. Some analysts say that the correlation is a temporary anomaly and that Bitcoin will become uncorrelated again.
The dollar index (DXY) (blue) has been a useful tool for benchmarking bitcoin’s price performance, as strong DXY has indicated weak bitcoin and weak DXY strong bitcoin, vice versa. The dollar index has been in a technical parabolic advance since January this year, forming a seemingly never-ending dollar bull hegemony. However, now the parabola seems to be broken as DXY saw a pullback from 109 to 105.
Bitcoin’s correlation with the dollar this year has been deeply negative, dropping to a low of -0,48 in late May. The negative correlation has effectively meant that the dollar has been booming amid the cryptoasset bear market. The breaking of the dollar’s technical parabola will likely give Bitcoin some long-awaited leeway.
Correlations: Macro
Source: Coin Metrics
No Data Found
CRYPTO CORRELATIONS
Cryptoassets are known to be heavily correlated with each other, making normal diversification methods difficult. A look at 90-day Pearson correlation data for 2022 shows how cryptoassets were loosely correlated in early 2022. The weak correlation was particularly obvious in the case of AAVE / BTC (turquoise), which was at 0,56 in early June. At the same time, the ETH/BTC correlation (violet) was much higher at 0,79.
The correlation data shows us a well known fact, during market corrections the correlations have a tendency to go towards one (1). The widespread of cryptoasset correlations starts to converge in June as spot prices weaken, showing AAVE / BTC relationship rising to 0,84 from early year 0,56.
Correlations: Crypto (90-Day, Pearson)
Source: Coin Metrics
No Data Found
Another trend to notice is the slowly weakening correlation of ETH / BTC, as it has fallen from June’s 0,93 to current 0,89. The weakening correlation of Ethereum and Bitcoin stems from Ethereum’s upcoming merge, which is the main focus of investors. As Raoul Pal said, the hedge funds can’t afford to miss Ethereum’s potential merge rally. [7]
DECENTRALIZED FINANCE (DEFI)
Decentralized finance, abbreviated as DeFi, has evolved into a de facto driver of growth in the blockchain industry during recent years. Decentralized finance can be described as a cluster of decentralized applications (dapp), that are built on blockchain technology.
Compared with traditional centralized financial services, the value proposition of decentralized finance is to solve the inherent challenges within the legacy financial field. The biggest challenges within traditional finance are considered to be single points of failure, abuse of control, monopoly of power, and bureacracy.
The decentralization is achieved by using smart contracts, where the rules of the contract are embedded into code and implemented automatically. All transactional data is saved into a distributed ledger. The process makes sure that no single party has unilateral control over transactions, which would potentially allow censorship and disruption.
Total Value Locked (TVL) in Decentralized Finance
Source: The Block
No Data Found
Correlating with the wider market, rising rates, and quantitative tightening, the total value locked (TVL) of decentralized finance has been weakening. In the first quarter of 2022 the amount of total value locked to decentralized exchanges (DEX) was $63,68 billion and it has been halved to current $28,09 billion.
EXCHANGE RESERVES
Exchange reserves simply means the total amount of digital asset units held in exchanges. Per se, exchange reserves tell us how many coins are potentially available for market selling.
During a bull cycle, assets are usually withdrawn from exchanges into private wallets and allocated to long-term cold storage. This is especially true in bitcoin’s case. Respectively, in a bear cycle investors move the funds back to exchanges, in order to convert them to fiat currencies, stablecoins, or other digital assets.
The exchange reserves of Bitcoin and Ethereum have both decreased heavily since the early 2022. The amount of Bitcoin held by exchanges decreased in dollar terms from $90 billion to current $56 billion. The exchange reserves of Ethereum decreased from the spring $70 billion range into current $42 billion.
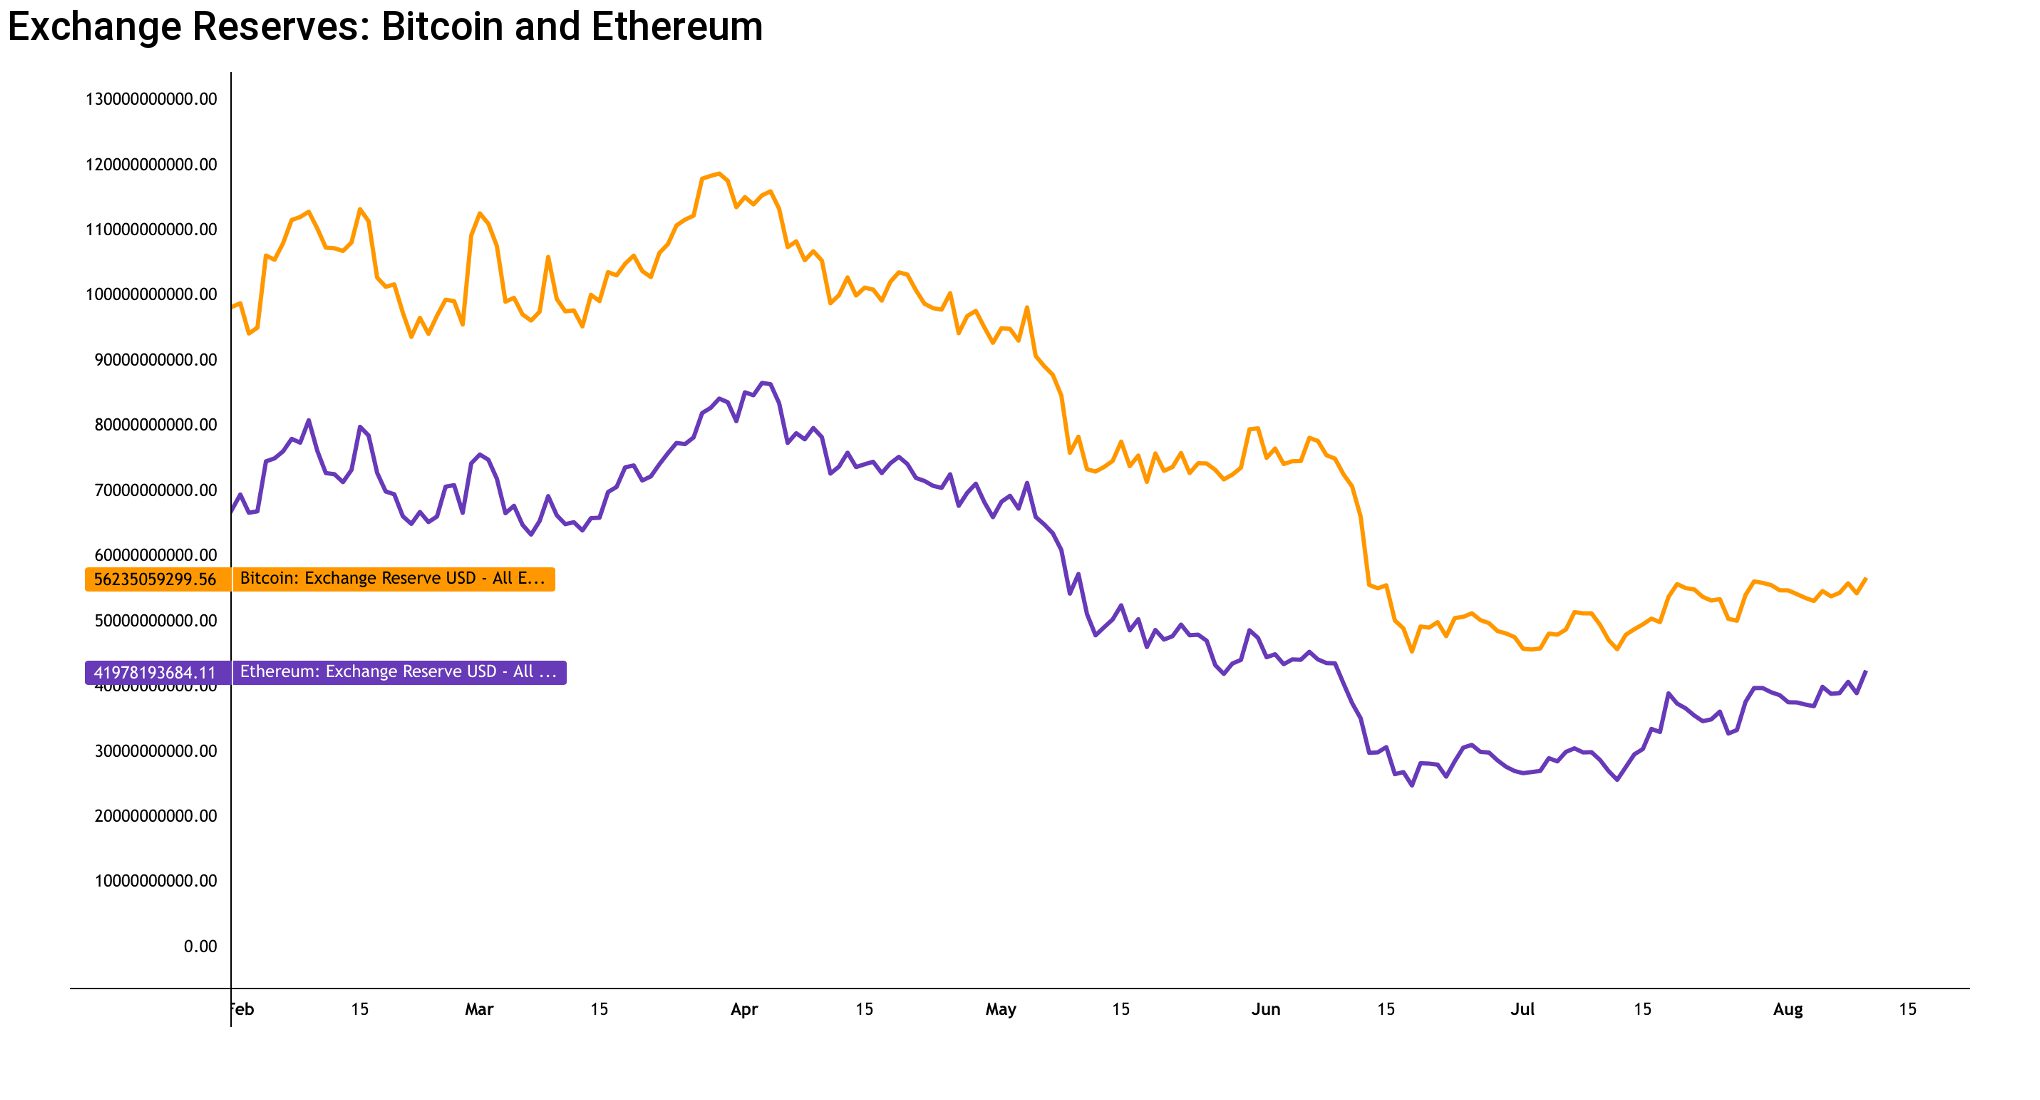
The secular multi-year downtrend can be interpreted as investors pulling their assets out of exchanges and into private custody. Both Bitcoin and Ethereum are about to become increasingly scarce and post-merge Ethereum might enter a deflationary spiral.
(SOUND) MONEY AND POLITICS
The markets have recently been stirred by escalating risk profiles of inflation, geopolitic, and central bank policies. The long epoch of zero rates are seemingly coming to an end, while the central banks try to curb off inflation.
In late July of 2022, the Fed announced a relatively dovish approach in its FOMC meeting and stated the economy and inflation to be already slowing down. Markets were generally waiting for a hawkish approach path and some analysts even estimated a 100 basis point hike in late July. In contrast to expectations, the Fed only increased rates by 75 basis points. [8]
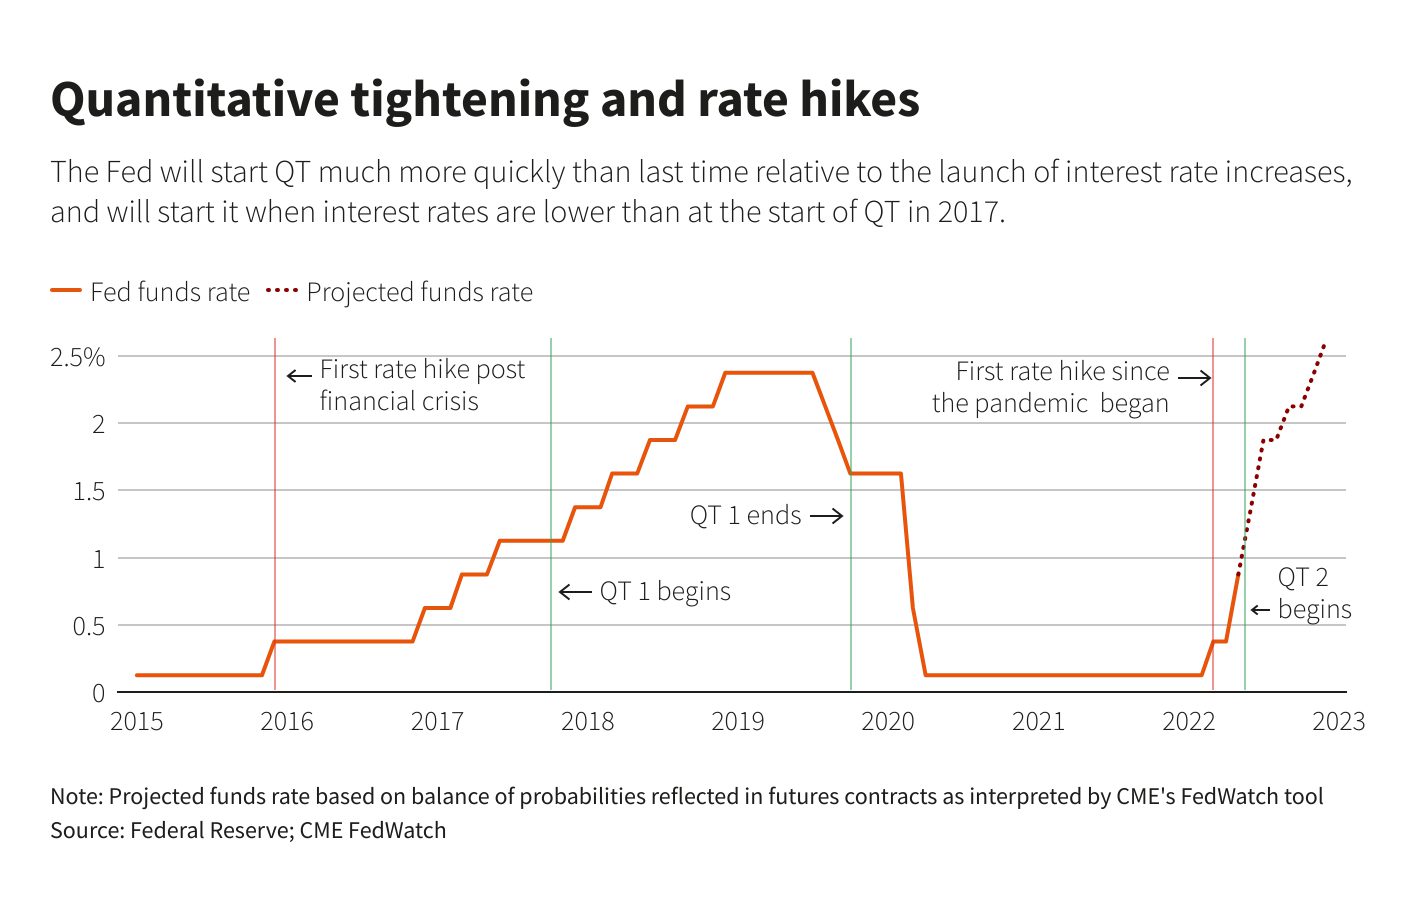
Now the markets are waiting if the Fed truly plans to follow the anticipated quantitative tightening (QT) path, or would it decide to go back into (stealth) quantitative easing (QE). While the flow of “cheap” dollars has particularly supported the small-cap tokens of the blockchain industry, we should remember that cryptos surged upwards despite the quantitative tightening season of 2017.
Despite the challenging macro environment, Deutsche Bank recently gave a $28K spot price target for Bitcoin. The forecasted Bitcoin to rise higher in correlation to wake of the recovering stock market. [9]
REFERENCES
[2] https://twitter.com/brian_armstrong/status/1554884568347340801?s=20&t=2ZzjP_jydvEBQCMcCekOwA
[4] https://twitter.com/ChandlerGuo
[5] https://www.huobi.com/support/en-us/detail/94914028834041
[6] https://unchained.com/hodlwaves
[7] https://twitter.com/RaoulGMI/status/1553791022274121729?s=20&t=sP2kOEQxk665SIr5p8lRjg
[9] https://coinmotion.com/deutsche-bank-sees-bitcoin-recovering-to-28k-level