

MARKET INSIGHTS
Table of Contents
ORGANIC GROWTH IN RETAIL AND INSTITUTIONAL COHORTS
The year 2021 was an epoch full of organic growth, emerging from both retail and institutional segments. As the year 2020 can be seen as year of institutional Bitcoin, the 2021 was influenced by wider adoption, reaching state-level institutions. While El Salvador granted bitcoin legal tender status in September 2021, more recent developments show cities like Rio de Janeiro jumping in the game.

Grayscale recently announced bitcoin adoption data which indicates that a whopping 26 percent of U.S. citizens already own bitcoin. This is a clear rise from 2020’s 23% and the growth mirrors increasing mainstream adoption. According to Grayscale, more than half (59%) of these investors prefer to use apps like Coinbase for their transactions.
Grayscale also points out that more than half (55%) of current Bitcoin investors entered the market within the past 12 months. According to Grayscale most of these investors have chosen a buy & hold strategy as 66% of those who purchased bitcoin within 12 months still own the asset today.
Additionally, investors perceived Bitcoin differently in 2021 than in 2020. Grayscale states that in 2020 the majority of investors considered Bitcoin as a form of money. As a contrast in 2021 majority investors perceived Bitcoin as a form of investment.

37 percent of investors interviewed by Grayscale considered Bitcoin as a short-term speculative investment. However up to 55% of investors consider bitcoin as a long-term investment, seeing it as a Store of Value (SoV) asset. Investors are clearly seeing Bitcoin’s potential as a long-term alternative asset and inflation hedge.
”The rational strategy in the face of escalating inflation & taxation risk is to construct a portfolio of scarce, desirable, portable assets that you can hold forever.”
– Michael Saylor
CRYPTO FUNDS > HEDGE FUNDS
Hedge Fund Research reported that crypto funds wildly outperformed traditional hedge funds in 2021. Crypto Funds on average gained 214 percent last year, while the hedge funds only squeezed a profit of 10 percent. The main U.S. stock market index S&P 500 also performed well in 2021, rising 29,79%. Bitcoin’s performance was 57,78% last year, performing 2x better than the stock market. These figures show how small-cap cryptoassets, traded by crypto funds, offer significant growth potential. However we should remember that this potential comes with a rising risk profile.

INSTITUTIONAL BITCOIN
Grayscale has remained as the number one Bitcoin institution in terms of treasuries and the company currently holds 654 885 native bitcoin units. Grayscale was already founded in 2013 and the soon-to-be 10 years old company has been able to establish its leading position, especially in the United States. Grayscale plans to join the Bitcoin ETF game this year by converting its most popular product Grayscale Bitcoin Trust (GBTC) into a spot ETF.

Block.one holds 164 000 bitcoin units in its treasury, making it the second largest institution in terms of bitcoin units held. Block.one is perhaps best known as the parent company of EOS, the enterprise describes itself as “blockchain software company”. Probably the most famous Bitcoin institution MicroStrategy takes the third place among treasuries, currently holding 124 391 BTC. MicroStrategy’s story is unique and its CEO Michael Saylor is considered as an industry-leading thinker.
The European CoinShares is currently the fourth largest bitcoin holder with 69 730 coins. The company is known for its selection of bitcoin-related asset management products. Tesla is the fifth biggest bitcoin institution globally, holding 43 200 units. In addition to Tezos Foundation, the Canadian 3iQ Bitcoin Fund rises to the list, holding 23 459 bitcoins as an ETF.

Cryptoassets under management (AUM) grew steadily through 2021, rising from 36,23 billion USD in the first quarter to 59,6 billion in Q4. In addition to bitcoin treasuries, Grayscale leads the cryptoasset AUM as well, rising to $50 billion in 2021.
The leading European firm CoinShares has an AUM of approximately $5 billion. CoinShares estimates that the SEC’s possible decision to approve the first Bitcoin spot ETF could lead to fresh investors entering the market and significantly push inflows higher.
“Bitcoin answers the question of how does civilization produce an asset which has the lowest amount of counterparty risk when measured over the longest time frames.”
– Zhu Su
VENTURE CAPITAL
In 2021 $30 billion worth of venture capital (VC) money flowed into the cryptocurrency industry, eclipsing all previous yearly inflows. The venture capital money is especially interested in decentralised finance applications and the new NFT market.
Coinbase Ventures took the biggest slice of VC deals, accumulating 68 in 2021. Coinbase Ventures is a subsidiary of the leading North American exchange Coinbase. Digital Currency Group, known for its Grayscale financial products, amassed 53 deals during 2021. Other significant sources of venture capital funding were names like Polychain Capital, Pantera Capital, and Andreessen Horowitz.

BITCOIN LONG & SHORT TERM INVESTORS
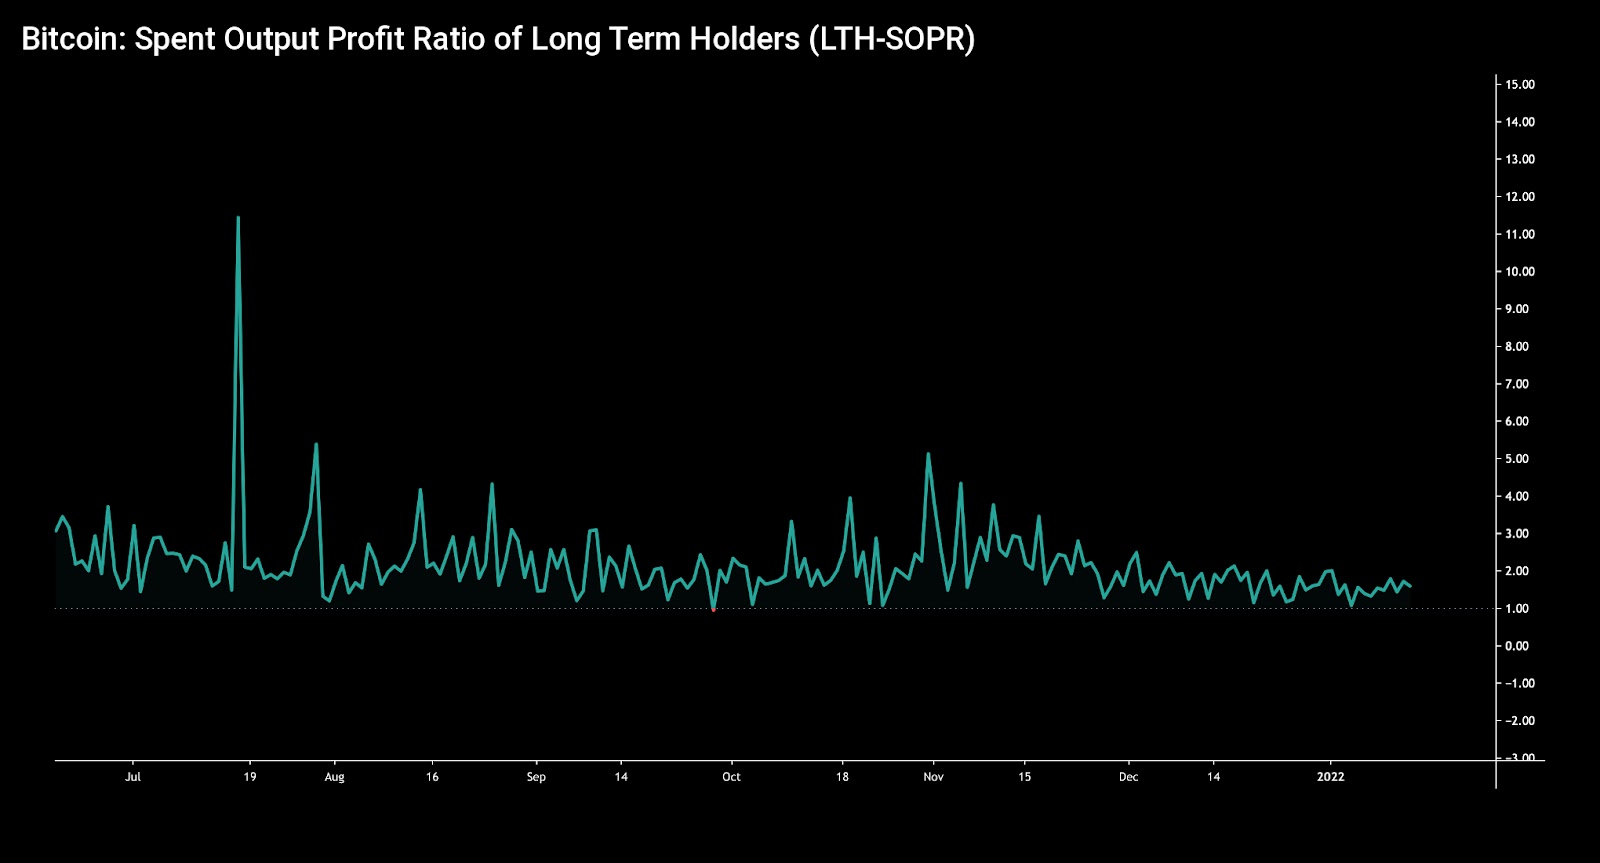
As we know Bitcoin favours long-term holders as an asset. On a long enough time horizon Bitcoin can always be seen to be in a bull market. The success of long-term strategy is more than just an investment narrative and it can be proven by Spent Output Profit Ratio (SOPR).
The SOPR indicator, originally created by Renato Shirakashi, is calculated by dividing the realised value (USD) by the value at creation of the output. SOPR indicator is usually divided into Short-Term Holder SOPR (STH-SOPR), and Long-Term Holder SOPR (LTH-SOPR), indicating if long and short term investors are at profit or loss. Or more simply: Price sold divided by price paid. SOPR indicator can be interpreted by following logic:
SOPR > 1 = Sellers at Profit
SOPR < 1 = Sellers at Loss
The SOPR indicator for long term holders (LTH-SOPR) shows SOPR being well over 1 in Q3 and Q4 of 2021. The LTH-SOPR even crossed value of 10 during July’s inflection point, after which the sentiment quickly shifted from bearish to bullish.
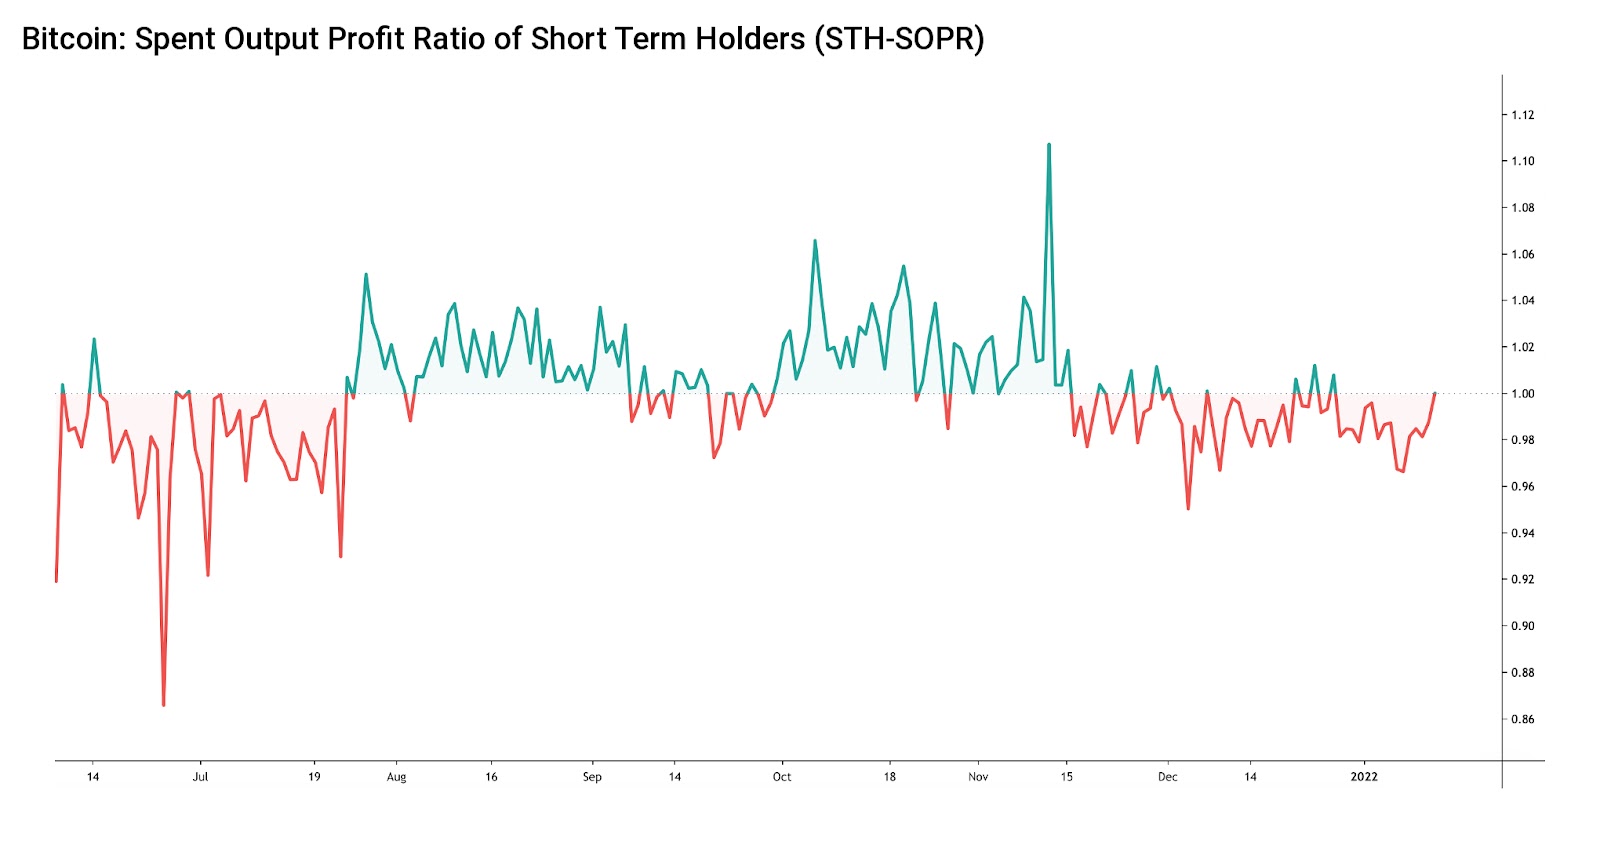
The SOPR data of short term holders looks fundamentally different. As we can see the chart is largely painted in red, indicating losses and below one SOPR. The deepest short term holder SOPR happened in mid-June as the metric dropped to 0,87. The data clearly supports our thesis of holding over short term trading.
BITCOIN HODL WAVES (UTXO AGE DISTRIBUTION)
Bitcoin was originally designed as a transparent network. The transparency allows researchers to deeply explore the network and its UTXO structure. UTXO Age Distribution, or more commonly known as HODL Waves, presents a macro view of Bitcoin investor behaviour. The UTXO data can be analysed by dividing the HODL Waves into six segments. Here’s a rough estimate on each HODL Wave’s trend:
10Y Active Supply: Long-Term Holding
5Y Active Supply: Holding
4Y Active Supply: Selling Pressure
3Y Active Supply: Slight Selling Pressure
2Y Active Supply: Accumulation
1Y Active Supply: Selling Pressure
180D Active Supply: Possible Accumulation


As we can see the UTXO data supports the current paradigm of long-term holder accumulation and growing weakness in shorter term cohorts. The 10 year active supply wave has been going sideways for years, presenting no significant change in ultra long-term investor behaviour. These bitcoin investors are “holders of last resort” and they likely just hold regardless of the spot price. The 3Y-5Y waves are showing steady holding combined with slight selling pressure, these waves represent long-term holders and also institutional investors. The 2 year (2Y) active supply looks particularly promising, mirroring coins moving to long-term hands. Shorter cohorts show de-risking and increasing selling pressure.
INSTITUTIONAL BITCOIN THESIS
Bitcoin combines multiple different attributes and the benefits of owning are usually obvious for retail investors. But how to recommend Bitcoin as an institutional investment? One approach is to divide Bitcoins institutional value proposition into three tranches: Defensive, opportunistic, and strategic.
Bitcoin is an excellent hedge against inflation. Storing cash reserves in the corporate balance sheet is risky as fiat currency is losing its value in an escalating manner. According to recent data, Germany’s inflation is rising at the fastest rate in 28 years. Bitcoin offers companies a defensive hedge against unsustainable monetary policies.
Bitcoin is a highly scarce asset class, and recent data shows only 24 percent of bitcoin’s supply being liquid. Bitcoin’s built-in scarcity combined with illiquid supply creates a setting for a perfect storm, potentially leading to parabolic price advances. Even allocating a small percentage of corporate cash reserves to bitcoin creates a huge upside opportunity. In a bigger picture, Bitcoin heavily disrupts the traditional finance industry, offering a valid decentralised alternative.
Bitcoin allocation can be seen as a strategic investment, combining the company’s business moat with digital gold. As Michael Saylor mentioned, MicroStrategy’s software revenue grew at zero percent per year until their bitcoin allocation. The bitcoin strategy was brilliant in a strategic sense but also enhanced MicroStrategy’s underlying software business.

In July 2020, Michael Saylor and his company MicroStrategy (MSTR) brought institutional Bitcoin thesis to wider audiences. Saylor announced MicroStrategy to explore purchasing bitcoin, gold, and other alternative assets instead of holding cash (USD). Saylor’s public statements marked a turning point in the way institutions consider Bitcoin and digital assets, leading to broader acceptance towards the asset class.

Michael Saylor’s effect on the bitcoin market has been monumental since summer 2020. Bitcoin’s spot price (BTCUSD) has increased +402 percent since MicroStrategy announced its new path in terms of price performance. MicroStrategy’s new direction has also been incredibly beneficial for the publicly listed company itself, with MTSR stock growing parabolically almost 1000% from Q3 2020 to Q1 2021. Saylor has disclosed that he holds 17 732 bitcoins with an average buy price of $9882.
“Bitcoin is the most universally desirable asset property in space and time. It’s the property with the lowest maintenance cost.”
– Michael Saylor
How did MicroStrategy time its purchase of 124 391 bitcoin units? The answer is dollar-cost averaging (DCA). Dollar-cost averaging is an investment strategy in which the investor divides the total amount invested across periodic purchases of a target asset to reduce the impact of volatility on the overall purchase. The purchases occur regardless of the asset’s price and at cyclic intervals.
Smart money is flowing into Bitcoin.
Join 160,000 investors on Coinmotion:
MicroStrategy has purchased BTCUSD on sixteen occasions with an average purchase price of 40436,75 USD. DCA removes much of the detailed work of attempting to time the market in order to make bitcoin purchases at the best prices. In summary, MicroStrategy has entered a buy & hold mode: Only on the buy-side, holding regardless of the market situation.

Bitcoin currently makes up to 109% of MicroStrategy’s market cap. MicroStrategy can be considered as a 1,09 times leveraged unofficial Bitcoin ETF, with cash flow generating business intelligence as an additional bonus.
“One year ago we were a $500 million software business, growing 0% per year. Today we’re a $500 million sw business growing 10% per year, and a $5 billion (digital property) bitcoin business, growing >100% per year.”
– Michael Saylor on MicroStrategy
BITCOIN DOMINANCE
Bitcoin’s dominance was inching below 40 percent at the turn of 2021 and 2022, effectively ending a multi-year trend of Bitcoin market capitalization dominance. The index hasn’t been this low for years and last time Bitcoin dipped below 40% happened during summer of 2018. Bitcoin momentarily crossed above 70% dominance in early 2021’s bull cycle, but has been losing relative market share to other digital assets since.

As Bitcoin’s dominance seems to have entered a secular downtrend, what are the factors behind this paradigm shift? While Bitcoin remains as the de facto leading cryptocurrency, other digital assets are outpacing Bitcoin in growth and quantity. Additionally new sectors like decentralised finance (DeFi) and non-fungible tokens (NFTs) are gearing up and gaining market share. However the new cryptoassets are not directly competing with Bitcoin, so it’s hard to see them as an existential threat to Bitcoin itself.
“The Bitcoin Maxi thesis is Lindy Effect. The Alt-coiner thesis is competing Cantillion Effect.”
– Willy Woo
MACRO PRICE PERFORMANCE IN 2021
Macro price performance YTD:
- BTC: +57,77%
- S&P500: +28,79%
- Gold: -5,73%
2021 was an intriguing year for Bitcoin and digital assets, creating a double top pattern for BTC as it peaked in quarter two (Q2) and four (Q4). When benchmarked against traditional stock market indices like S&P 500, the stocks had a good year rising +28,79 percent. The stock market was mainly propelled up by technology companies, including Bitcoin-related firms like Tesla and Coinbase. Technology stocks have been increasingly correlated with digital assets and these both cohorts have been supported by dovish monetary policies.

Gold’s year continued its negative trend, falling -5,73% during 2021. Gold has been struggling to keep up with other asset classes and haven’t been performing well despite the rising inflation. Some analysts are even saying that gold’s investment narrative is broken, however gold might be able to enhance its performance in 2022.
PRICE PERFORMANCE: DIGITAL ASSETS
Digital asset price performance YTD:
- Bitcoin +57,77%
- Ethereum: +404,43%
- Aave: +185,26%

Bitcoin climbed a healthy +57,77 percent in 2021, eclipsing traditional assets, but it was outperformed by many small cap altcoins and tokens. As a default the newer altcoins are more volatile than bitcoin, carrying increased profit potential combined with more risk. In these times of exceptionally loose monetary policies the altcoins might also be more vulnerable to Fed’s tightening. The “cheap dollar” has been flowing through all markets in 2020-2021 and investors are reducing speculative exposure first.

“Investors these days often say that fundamentals don’t matter anymore. Well, fundamentals matter a lot more during periods when stimulus stops flowing.”
– Lyn Alden
CORRELATIONS
According to historical data the cryptocurrencies have closely followed bitcoin’s price action and consequently altcoins and bitcoin have been highly correlated. This fundamental rule has particularly applied to older (legacy) cryptocurrencies, which have been highly correlated with BTC. On the other hand, newer decentralised finance (DeFi) tokens have usually been more weakly correlated with dominant bitcoin.

The correlation chart for 2021 reveals how bitcoin was weakly correlated with altcoins in the first quarter (Q1), however May’s correction shifted this setting. As spot prices saw a correction in May, the correlations swiftly moved towards one. Later in Q3-Q4 correlations weakened slightly but stayed in close proximity to bitcoin. The correlation data of 2021 confirms the known thesis: In spot price corrections correlations tend to shift towards one (1).
ETHEREUM & COMPETING DEFI PLATFORMS

The leading decentralised finance platform Ethereum is currently being rendered more scarce, imitating Bitcoin’s fundamental features. The increasing digital scarcity was successfully implemented with the EIP-1559 upgrade that fundamentally changed Ethereum’s structure. The protocol-level EIP-1559 hard fork focused on making the network more scarce and lowering transaction costs.
The Ethereum network is being rendered more scarce by digitally burning transaction base fees, significantly reducing the supply. Consequently Ethereum’s supply is expected to peak during late March or early April of 2022 at 118,4 million Ether units.
As the embedded chart shows, the total amount of burned Ethereum fees reached 19 424,89 ETH in early weeks of 2022, marking an all-time high.
Ethereum (ETH) has been perceived as the de facto decentralised finance (DeFi) platform. Ethereum’s history dates back to the year 2015 when it was launched by Vitalik Buterin and Gavin Wood. The original value proposition of Ethereum was to be “one computer for the entire planet” and Ethereum has been evolving its narrative slightly since then. In the 2017 bull cycle Ethereum ecosystem was the main decentralised platform for a new kind of funding rounds, initial coin offerings (ICOs).
Ethereum has been extensively utilised as a platform for decentralised applications (dapps) and more recently for non-fungible token art (NFTs). Ethereum is the leading DeFi ecosystem with $347,59 billion market capitalization. Despite Ethereum’s dominant position, it has been challenged in recent years by competitors like Cardano (ADA), Solana (SOL), and Avalanche (AVAX).
Cardano’s transaction fees are low compared to Ethereum and it can handle almost 20 times more transactions per second than ETH.
Although Cardano clearly contains a notable future potential, its expansion speed has been slow compared with Solana, and its developer base lags behind the two competing projects. If Cardano can solve its slow(ish) progress and scale its developer community, it might evolve into a true ”Ethereum killer”.

The Solana network can handle 65 000 transactions per second, lifting it to another level compared with Ethereum’s 15. However, this transaction speed is achieved via centralization, compared against Ethereum’s more decentralised structure. The centralised nature of Solana has been suffering from a series of DDoS attacks.
Avalanche, founded by famous computer scientist Emin Gün Sirer, is the newest Ethereum challenger in this cohort. The Avalanche protocol was firstly developed at Cornell University where Emin holds a position as assistant professor. Avalanche claims to conduct faster transactions than Ethereum, yet it can be considered as new and relatively untested technology. Avalanche currently has a market cap of $16,08 billion.
NFTS
Cointelegraph recently published its new NFT report, which estimates huge growth momentum for the emerging industry. Particularly art and collectibles have gained interest among buyers and these cohorts account for over 90 percent of combined NFT sales. In addition to art and collectibles NFTs are part of strategic corporate thinking: Coca-Cola, Nike, and Visa published their own NFT programs in 2021.
The combined sales of NFTs in 2021 are estimated to rise above 17,7 billion USD. The leading decentralised finance (DeFi) platform Ethereum has established itself as the key seedbed for NFTs, and consequently >80% of NFT transactions are processed through Ethereum. The NFT market would need more regulated exchanges in order to scale safely and gain more liquidity.
The leading, but unregulated, NFT platform OpenSea is currently the leading gas consumer on Ethereum platform, using 52,3K gwei worth of gas during the last 30 days. The closest gas guzzler Tether (USDT) uses only less than ⅓ of OpenSea’s gas. The leading decentralised exchanges (DEX) Uniswap V2 and V3 only use a fraction of Opensea’s gas. This trend might indicate a new incoming “flippening” where NFTs take the leading position in decentralised finance and exchanges like Uniswap are sort of an old narrative.
INDICATORS
NVT
Bitcoin NVT is calculated by dividing the Network Value (MCAP) by the daily USD volume transmitted through the blockchain. NVT indicates whether bitcoin’s price is overvalued or undervalued. Bitcoin saw especially high NVT values during the early years and NVT is a sound indicator for revealing high speculative value. Similar P/E trends can be seen within early growing companies of the traditional stock market.


At the end of the fourth quarter of 2021 and in early 2022 the 90 day moving average NVT dropped below the value of 50, indicating deep undervaluation. In early January 2022 the NVT reached 40,37, a lowest NVT in years. The recent spot price lows of June 2021 and March 2020 only reached 46,33 and 55,35, respectively. The crash of December 2018 caused the NVT to drop 40,69. Consequently the 90 day MA NVT of 40,37 shows Bitcoin being heavily undervalued.
WHALES IN RE-ACCUMULATION MODE
As we know the crypto asset markets are heavily influenced by whales, who by the common definition own at least 1000 native bitcoin units. Whales are known to make smart entries and exits compared with the retail investor segment and many analysts try to interpret their behaviour. Especially Bitfinex whales have been active recently.
Looking back at the year 2021, whale activity heavily increased in the parabolic spot price advance of quarter one (Q1). The amount of native bitcoin units in whale addresses peaked in early February 2021 at 8,06 million BTC. Then the whales started a sudden de-risk campaign, reducing their exposure to 7,78 million units in mid-April. This means that whales front-runned retail again and anticipated the overheated market and subsequent correction in May. The whales de-risked well before May’s huge spot correction.

The whales started to accumulate against the falling spot price during summer of 2021 and continued buys until late September. In early October whales de-risked mildly and have continued to buy again in early weeks of 2022. Whales are currently in risk-on mode, despite the weakening (or stagnant) spot price.
MONEY & POLITICS
In the last quarterly report we explored Federal Reserve’s (Fed) monetary policies and upcoming “tapering”. As most investors know the Federal reserve has been implementing radically loose stimulus programs in order to mitigate the COVID-19 effects. These policies have included quantitative easing (QE) and consequently over 20 percent of all U.S. dollars in circulation were created in 2020, as estimated by Andreas Steno Larsen.
The revolutionary amount of new dollars have found their way into all asset classes, including cryptoassets. The big question is how much is the market stimulated by the dollar inflow? Nevertheless the tide is already turning as the Fed now needs to battle increasing inflation. Inflation recently reached 7% in the United States, marking a 39 year high.
As a summary it seems that the epoch of the incredibly cheap dollar seems to be over for now, as the Fed needs to close the dollar faucet. This is done by a process called “tapering” that is basically inverse quantitative easing. Analysts expect the tapering to start in March 2022.

Despite all this, some analysts are sceptical if the Fed’s plan is to really reduce QE in the long term, or just momentarily reduce the amount of inflation. The Fed’s balance sheet is still growing and a radical shift from loose to tight monetary policy might be fateful. Additionally, markets are efficient to price in possible threats and after bitcoin’s spot price has already corrected -50% from November, one might ask if the tapering is already priced in?
“On average, U.S. has expanded the money supply by 7% p.a. since 1971. 7% is the rate money collapses in value. If you don’t generate (at least) a 7% return per year, you’re not actually keeping up with the money supply expansion.”
– Michael Saylor