

The technical analysis of week 38 explores bitcoin’s resilience amid the equity market sell-off. Additionally, we examine a selection of on-chain metrics and ponder if it’s possible to successfully trade the FOMC events.
Bitcoin Surprisingly Resilient Amid The Equity Market Sell-Off
The leading cryptocurrency bitcoin has shown exceptional resilience amid the recent stock market sell-off. Bitcoin’s antifragility is mirrored by its performance against the main stock market index S&P 500, which is down almost -10 percent within past 30 days. Bitcoin, however, has only weakened by one (1) percent within the same time horizon. The current market structure hints towards an anticipated decoupling, which would radically reduce bitcoin’s correlation with the main street.
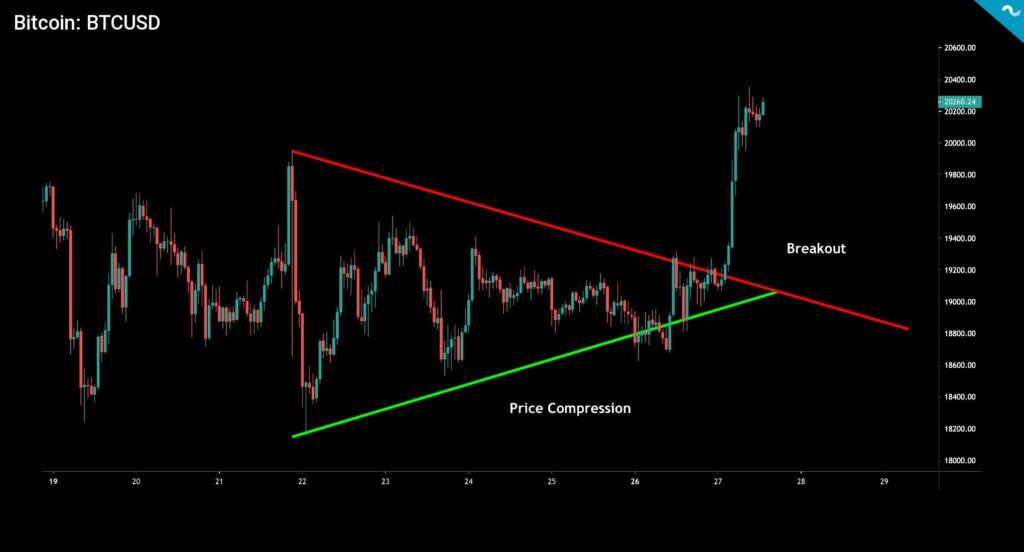
During the night of September 27 and 28, bitcoin’s spot price saw a notable breakout from $19K to $20K, rising above its downward sloping resistance line (red). Bitcoin is also supported by the technical wedge base (green). The recent market move seems decisive after bitcoin has been trading sideways since mid-September, drifting towards price compression.
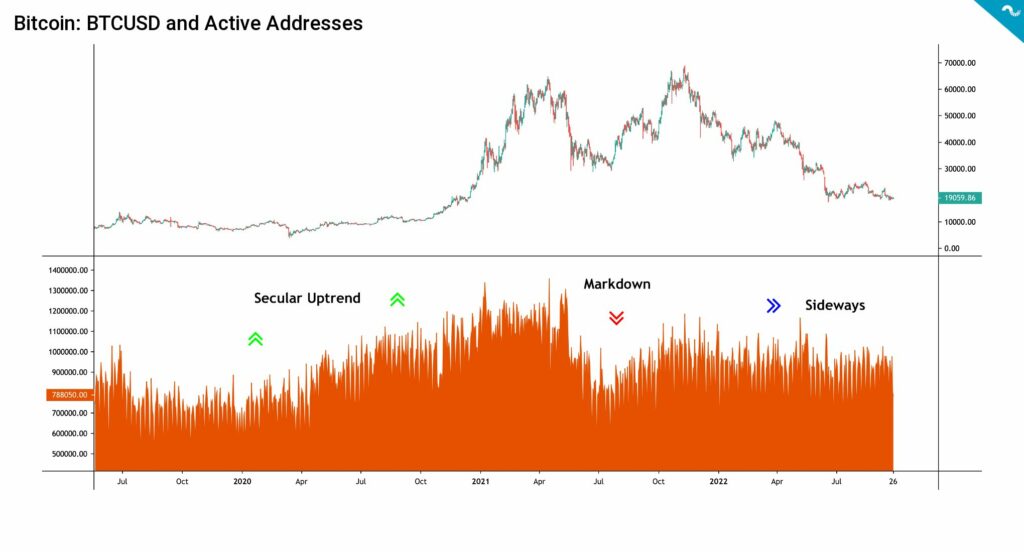
Bitcoin’s active addresses mirror the transactional frequency of the market. Growing amount of active addresses has been a leading indicator to spot price increases, and stagnant address count has correlated with bear markets, vice versa. In 2020, the active addresses formed a secular uptrend (green), increasing significantly before the spot price rally. This secular uptrend lasted until spring of 2021.
In April 2021, the active address count reached its multi-year high, however the activity dropped again in the markdown of summer 2021 (red). Since then the active addresses are seen advancing sideways, while the address count has not correlated with the falling spot price. The active addresses will likely be a leading indicator to the market again, however a macro-level shift will be needed before the market recovers.
7-day price performance
The leading cryptocurrency, bitcoin, has climbed 7,5 percent within the past seven days, accompanied by Ethereum at 7,2%. Higher beta tokens, like Uniswap, are up over 20%. The main stock market index S&P 500, had an exceptionally rough week, as it weakened by -6,28%. The allegedly safe haven asset gold is also in notable decline, dropping -2,92% in seven days.
Ethereum (ETH): 7,2%
Litecoin (LTC): 4,2%
Aave (AAVE): 4,8%
Chainlink (LINK): 13%
Uniswap (UNI): 21,1%
Stellar (XLM): 2,5%
XRP: 21,5%
– – – – – – – – – –
S&P 500 Index: -6,28%
Gold: -2,92%
– – – – – – – – – –
Bitcoin RSI: 45
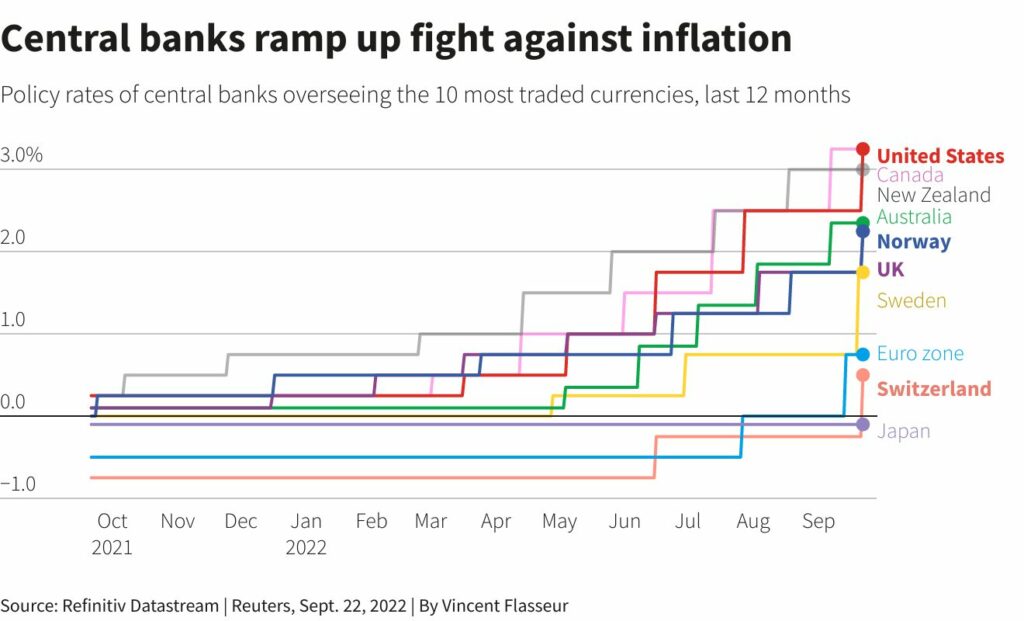
The central banks are trying to counter the threat of escalating inflation by ramping up interest rates. Last week, the markets again waited for the Fed’s FOMC meeting and the new interest rate decision. The Fed was expected to raise interest rates by 75 or 100 basis points, and the former was supported by a 84 percent consensus, according to CME. The market’s wait was rewarded in the evening when the central bank decided to remain more moderate with a 0,75 percent interest rate increase.
After the FOMC meeting last week, Fed has two upcoming meetings this year, on November 2nd and December 14th. The path of rising interest rates is probably not over yet but is it possible to speculate on the upcoming dovishness. The peak of inflation and the subsequent easing of the interest rate environment will be reflected in the valuation levels of digital assets.
How to Trade The FOMC Events?
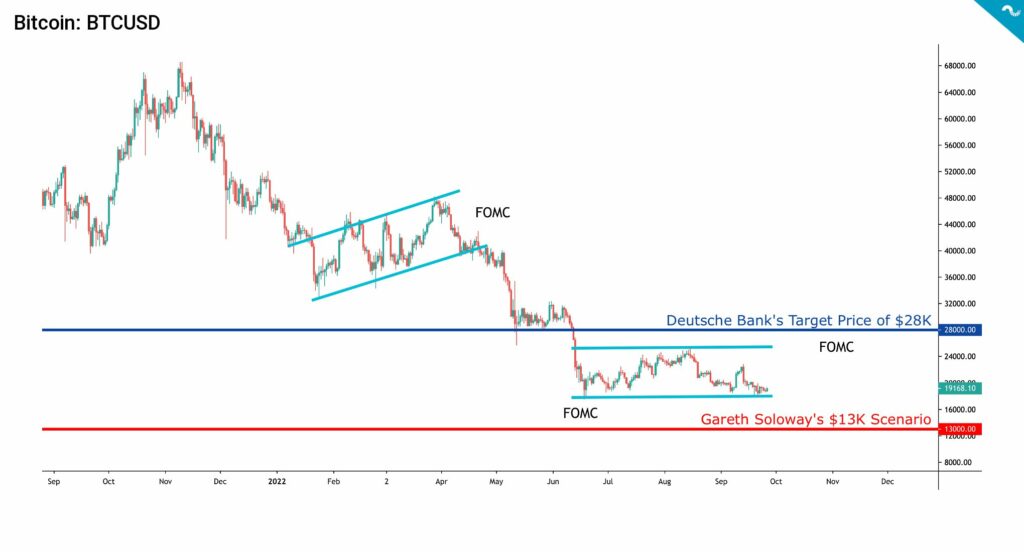
Fed’s FOMC meeting last week ended up in the anticipated rate hike of 75 basis points, even though investment bank Nomura suggested a possibility of a 100 bps hike. In the bigger picture, the FOMC meetings have been decisive in bitcoin’s spot price trajectories. Could it be possible to trade bitcoin with FOMC data? Let’s dive into the details:
- May 3-4 FOMC: Fed raised rates by 50 basis points, also announcing five upcoming rate hikes in 2022. Bitcoin’s relief rally ended.
- June 14-15 FOMC: Fed raised rates by 75 basis points, hinting at aggressive actions. Bitcoin’s spot price hits the bottom.
- November 1-2 FOMC (upcoming): The rate hike speculation could drive BTCUSD upwards towards the channel roof, although the meeting will most likely be a sell the news event.
In summary, we could possibly see bitcoin move upwards in its channel towards November’s FOMC, ceteris paribus. And the setting would be an opportunity for short-term traders. The charts also mirrors two important price scenarios for bitcoin: Gareth Soloway’s $13K scenario and Deutsche Bank’s $28K target price. Luke Gromen has been forecasting a mandatory pivot for the Fed, as rising rates cause obvious challenges for the economy. Markets will try to price in the possible pivot very early.
DEX Market Shares in Decline, While Centralized Exchanges Gain Ground
The research company Kaiko has reported how the volumes of the decentralized exchange Uniswap and Coinbase were almost equal. From July to autumn, however, the trend has reversed and currently Coinbase has grabbed 68 percent of the market share between the two exchanges. During the summer, Uniswap occasionally exceeded Coinbase’s market share Unit by 55-45, which can be considered an achievement for a DEX operator.
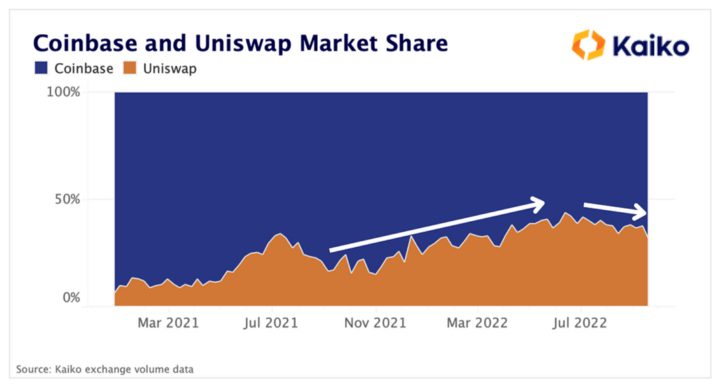
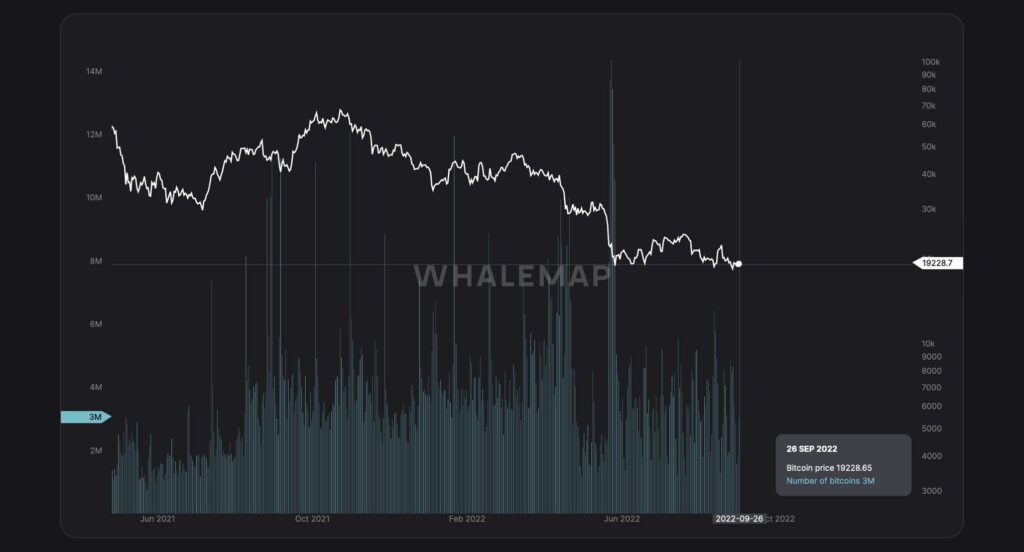
The Merge speculation of the last few weeks has strengthened the position of centralized exchanges, because the retail segment and institutional players prefer to keep their funds in them. However, the on-chain volume (chart below) has remained modest. In an uncertain market situation, investors see centralized and well-known operators as a safer alternative to decentralized exchanges.
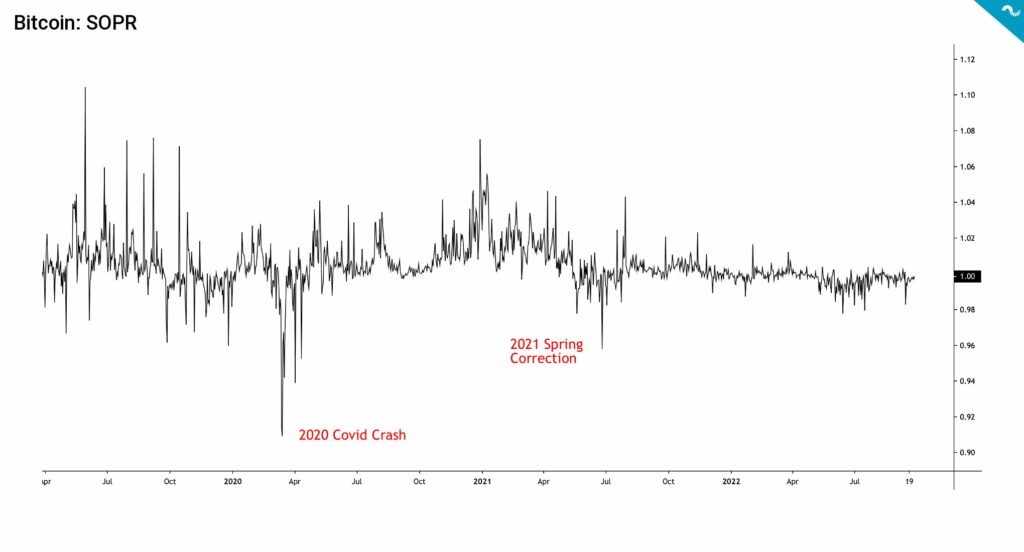
Has The Capitulation Occurred Yet?
The SOPR indicator, originally created by Renato Shirakashi, is calculated by dividing the realized value (USD) by the value at creation of the output. Or more simply: Price sold divided by price paid. SOPR indicator can be interpreted by following logic:
SOPR > 1 = Sellers at profit
SOPR < 1 = Sellers at loss
Bitcoin’s main SOPR indicator shows no significant losses yet, although the values dropped below 0,98 during summer’s sell-off. In the past bear cycles, the SOPR dropped to 0,95 during spring 2021 correction, and to 0,91 in 2020 COVID-induced crash. The SOPR indicator would point towards further price decreases in order to achieve organic capitulation.
What Are We Following Right Now?
Ronald-Peter Stoeferle, Managing Director at Incrementum AG, talks about why gold has not performed better this year, due to the strong US dollar, inflation expectations, equity markets, and crypto performance. He also explains why the US dollar has been “weaponized” during the Russia-Ukraine conflict.

The US dollar wrecking ball seems like an existential threat to weaker fiat currencies.
Will Clemente estimates the capitulation to be over already.
Create your account with Coinmotion today to start investing and spending cryptocurrency.

The views, thoughts, and opinions expressed in the text belong to the author and not necessarily to the author’s employer, organization, committee, or other group or individual.