The technical analysis of week 21 scans the past week’s market movements from a technical and fundamental perspective. We map, e.g., the impact of Bollinger bands on bitcoin, the exchange stablecoin ratio, and trading volume. In addition, we study the possible recovery of liquidity according to Raoul Pal’s thesis.
Bitcoin Squeezed by the Bollinger Bands
The crypto market has gathered new momentum since last week, raising bitcoin by almost three percent. At the same time, the leading cryptocurrency managed to cease its downtrend, consolidating its position at $27 000. The market is still reflecting the weakening of dollar liquidity, which may soon be at a turning point.
Nikolaos Panigirtzoglou, chief strategist at J.P. Morgan, sees strength in the alternative investment market, which includes digital asset classes such as bitcoin. According to Panigirtzogloum, the alternative investment market expanded from $25,5 trillion in the last quarter of 2022 to $26,1 trillion in Q1 of 2023. However, Panigirtzoglou points out that regulation is getting tighter and the challenges of growth financing.
“The universe of Alternative Investments (AI), consisting of hedge funds, real estate, digital assets, private credit, and private equity, is estimated to have expanded to $26.1tr in Q1 2023 up from $25.5tr at the end of 2022 and $25.7tr at the of 2021. The resilience in fundraising in the first quarter of the year suggests that overall demand for alternative asset classes remains solid.”
– Nikolaos Panigirtzoglou, J.P. Morgan
From a purely technical point of view, the Bollinger bands (purple) are squeezing bitcoin again after the expansion phase. At the moment, BB forces the spot price upwards. The volatility of bitcoin has been relatively small in May compared to the significant price fluctuations in March.
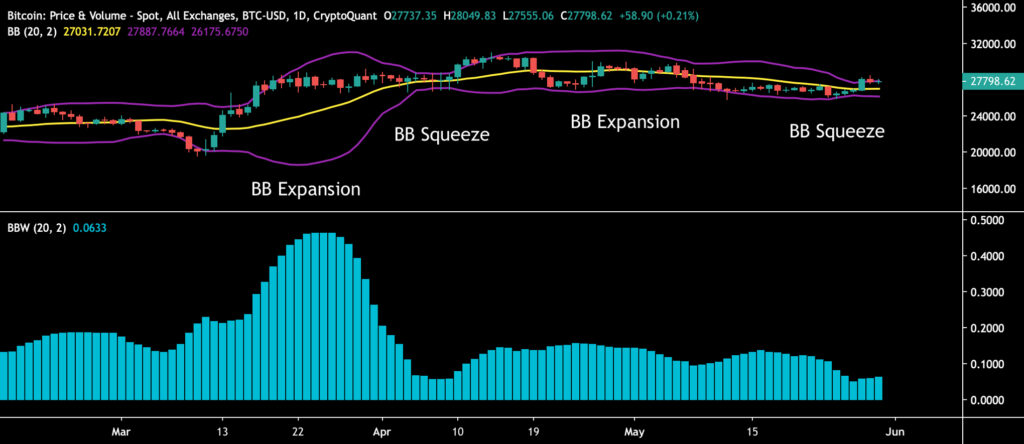
Sources: Timo Oinonen, CryptoQuant
Bitcoin has continued to follow its rising trendline (pink) from the late 2022 technical turning point. At the same time, the previously presented triple bottom structure of active addresses (white) supports the spot price. Additionally, a positive divergence has formed between the spot price (orange) and the addresses (turquoise). At the top, the exchange stablecoin ratio (yellow) acts as a magnet for bitcoin.
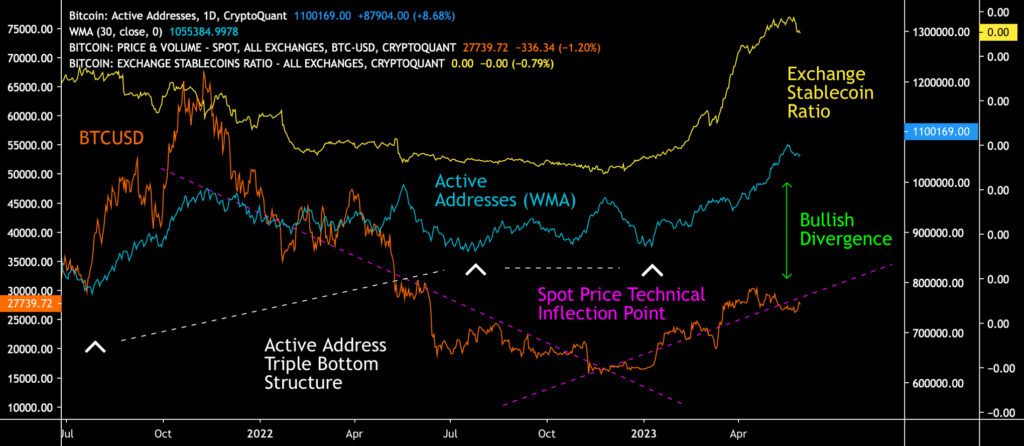
Sources: Timo Oinonen, CryptoQuant
The message of the Material Indicators heat map is clearly positive, as bitcoin’s bullish efforts are supported by the $27,5K level. On the other hand, the setup is divided, as both the $25,5K support area and the $29K resistance area have weakened. Cumulative volume delta (CVD) indicates that demand is now coming from whale-level players.
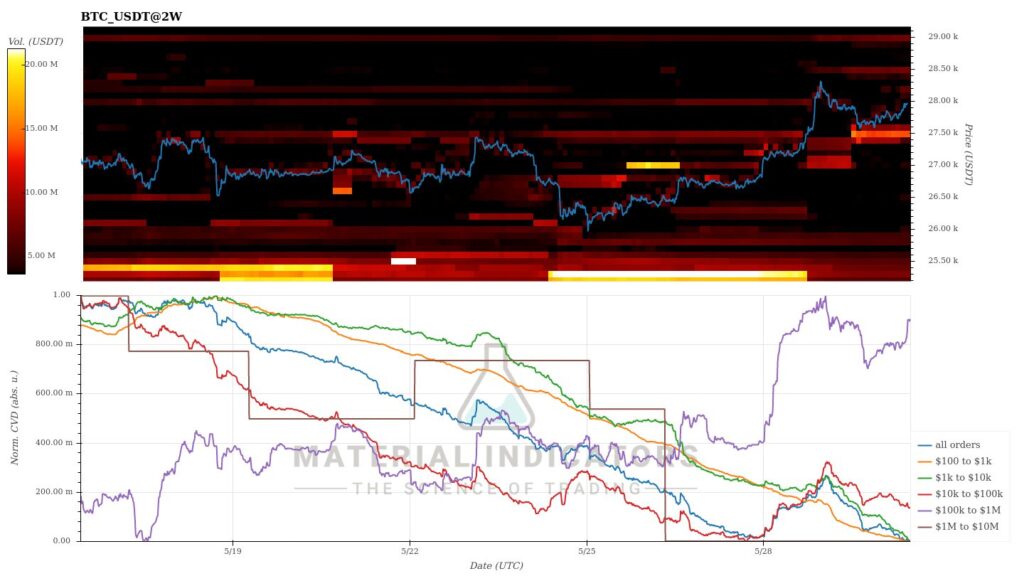
Source: Material Indicators
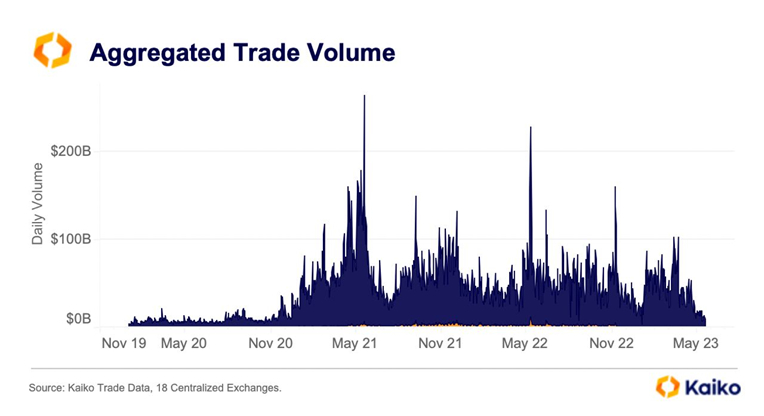
The aggregated trading volume chart mirrors the May phenomenon and the cooling of the market. Trading volume is now at its lowest level since 2020. However, the drop in liquidity may also provide opportunities for whale-level players, as bitcoin is prone to volatility in the current environment.
Source: Kaiko
Led by bitcoin (3,7%), cryptocurrencies have clearly strengthened over the seven-day time window, while the correlation between bitcoin and Ethereum (4,8%) remains strong. Bitcoin’s correlation is countered by Ripple Labs’ token XRP, gaining almost 13 percent in a week. Ripple Labs is in a legal battle with the US Securities and Exchange Commission SEC, and the positive trend can be interpreted as describing the success factor of Ripple Labs against the commission. The main macro market index S&P 500, strengthened by about 2 percent, and gold weakened by -0,3%.
7-Day Price Performance
Bitcoin (BTC): 3,7%
Ethereum (ETH): 4,8%
Litecoin (LTC): 6%
Aave (AAVE): 0,2%
Chainlink (LINK): 2,6%
Uniswap (UNI): 1,1%
Stellar (XLM): 6,3%
XRP: 12,9%
Get started with Bitcoin Litecoin Ethereum AAVE USDC Stellar Ripple
Join Coinmotion and buy your first cryptocurrencies within minutes!
S&P 500 Index: 1,6%
Gold: -0,3%
Is the Recovering Liquidity Uplifting Bitcoin?
Despite bitcoin’s latest correction, the leading cryptocurrency has rallied nearly 70 percent in the first half of the year, providing a stark contrast to the bear cycle of 2022.
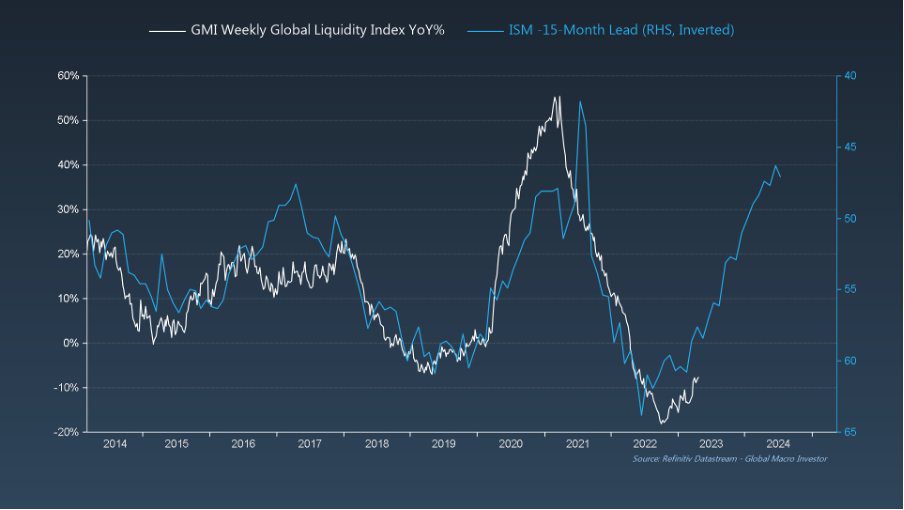
Bitcoin seems to follow Raoul Pal’s Exponential Age thesis, according to which technological development will accelerate the markets and change our perception of money. According to Pal’s latest analysis, global liquidity (M2) is at an inflection point and will recover towards 2024.
Sources: Global Macro Investor, Raoul Pal
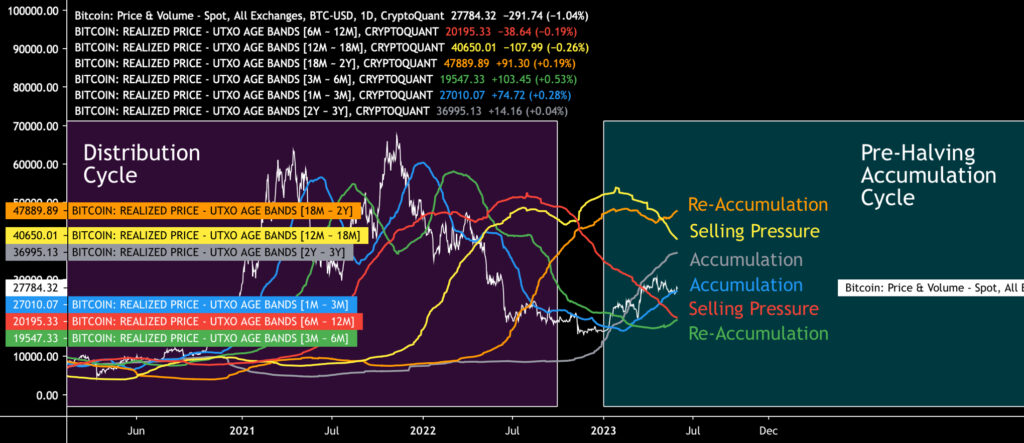
In the broader picture, bitcoin’s market behavior can be segmented into accumulation (turquoise) and distribution (purple) phases, which together form a multi-year series of cycles. Institutions such as MicroStrategy have traditionally been active in accumulation cycles, while distribution cycles have been popular with retail investors.
Bitcoin’s Realized Price UTXO Bands are mostly signaling positive sentiment, as the 3M-6M (green) and 18M-2Y (orange) waves indicate re-accumulation. Additionally, the shorter timeframe, 1M-3M (blue) and “smart money” 2Y-3Y (grey) waves mirror a positive outlook. The spot price is momentarily held back by 6M-12M (red) and 12M-18M (yellow) waves, representing selling pressure.
Sources: Timo Oinonen, CryptoQuant
Bitcoin’s Halving in 331 Days
Bitcoin’s expected halving (or halvening) event is approaching next year, with estimated 331 days remaining. The halving scheduled for the end of April 2024 will drop the block reward received by miners from 6,25 to 3,125.
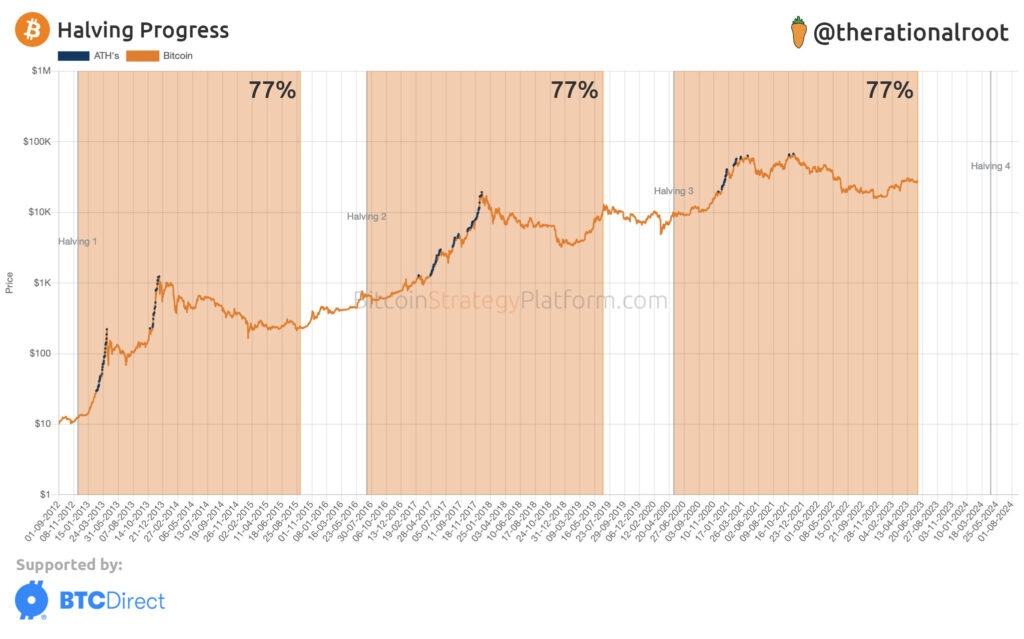
Historically, the halving events have acted as a catalyst for bitcoin’s price increases, with parabolic price development and the ATH usually occurring during the year following the halving. According to The Rational Root analyst, Bitcoin’s current halving cycle progress is at 77 percent (orange). In 2016, the price of bitcoin rose during this phase of the cycle; however, in 2019, the spot was in a downward trend.
Source: The Rational Root
Bitcoin’s fundamentals are also supported by the gradual increase in hashrate from the beginning of 2023. Although the hashrate does not directly or indirectly correlate with the spot price, it still tells about the popularity and profitability of Bitcoin mining.
Hashrate describes the computing power of the network, and more computing power means higher security, resilience, and defense capacity against attacks. Although the exact mining power of Bitcoin is unknown, it can be estimated based on the mined blocks.
Weakening Selling Pressure from Miners
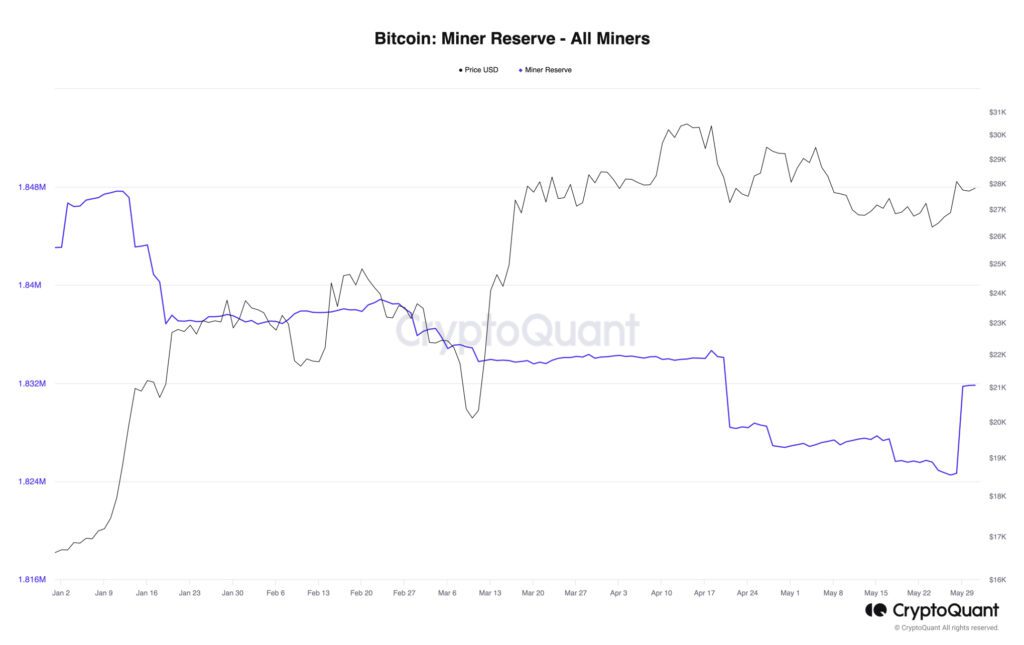
CryptoQuant’s miner reserve data shows that miners sold their holdings from January to May, generating downward pressure on the spot price. Miners tend to protect their positions by selling to the strength of the market, i.e., by selling when the spot price is in an upward trend.
The upward trend of spot continued until April, absorbing miners’ selling pressure at the same time. Now that the parabolic curve has been broken, miners may again have an interest in holding for two reasons: A. Selling to the spot price weakness will collapse the market, B. As the spot falls, miners will get even less from their coins, justifying the holding.
Source: CryptoQuant
Coinbase Premium Index Following its Trendline
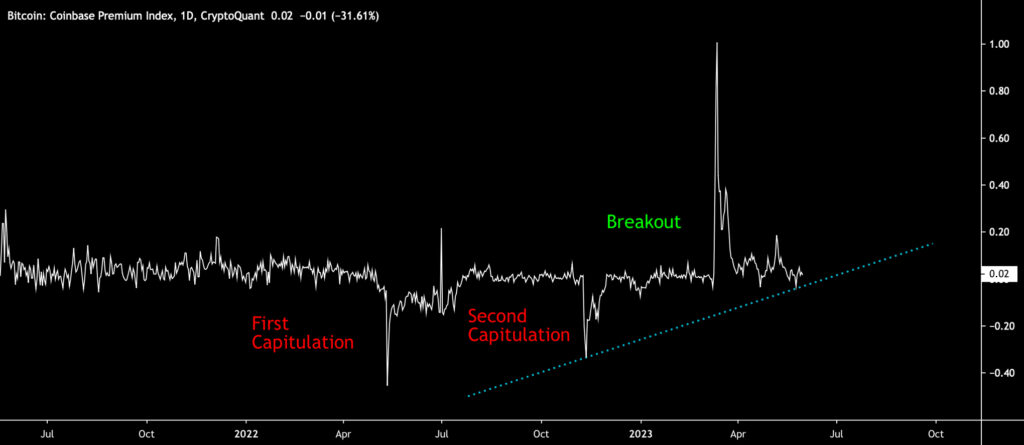
The Coinbase Premium Index shows how the market faced two capitulation moments (red) during the late spring and the end of the year 2022. However, the premium index has reached an exceptional rise, reaching a value of one (1) amid the spring’s parabolic price curve.
After the end of March spike, the premium index has continued its moderate rise, following its turquoise trendline. At the same time, the premium index is a positive signal amid the challenging US regulatory environment. As J.P. Morgan’s Nikolaos Panigirtzoglou mentioned, the alternative investment market looks good, while investors seek protection from the banking crisis.
Sources: Timo Oinonen, CryptoQuant
Coinbase was one of the first publicly listed crypto exchanges in the world (ticker: COIN) and the company is also one of the most transparent institutions in the industry. These features attract American institutions and HNWI clients to Coinbase. The embedded chart uses the Coinbase Premium Index, which measures the percentage difference between the bitcoin price on Coinbase (USD pair) and Binance (USDT pair).
What Are We Following Right Now?
Peter Schiff, a well-known gold influencer and crypto skeptic, has unexpectedly launched an NFT art collection based on the Bitcoin Ordinals protocol.
I'm pleased to announce an art project with one of my favorite artists, Market Price. This collaboration features the original painting “Golden Triumph” as well as a series of prints and Ordinals inscribed on the #Bitcoin blockchain. For information go to https://t.co/lEFJmgYTCk pic.twitter.com/vyoErYv39q
— Peter Schiff (@PeterSchiff) May 26, 2023
Analyst Lyn Alden explains why the bipartisan political support boosts Bitcoin’s prospects in the US.
While tech stocks like Nvidia have rocketed this year, Hong Kong’s Hang Seng index is down -21 percent year-to-date. The fall of Chinese stocks may also affect the local real estate market, which has a tendency to overheat.
Chinese stocks are now 'officially' in a #bearmarket, declining more than 20% from their January #reopening peak.#China pic.twitter.com/wjhmBw0XqX
— jeroen blokland (@jsblokland) May 31, 2023
Steven Lubka, responsible for Swan Bitcoin’s private clients and family offices, explains why HNWI clients are now more interested in bitcoin.
Stay in the loop of the latest crypto events
- Is Web3 the future of the Internet?
- Ripple (XRP): Empowering the future of digital currency
- Bitcoin on the Edge of 200-Week Moving Average
- Exploring altcoins updated meaning in 2023
- BRC20 tokens: How they differ from other cryptocurrencies
- How can decentralization save us in a world driven by AI?
- Beginner’s guide: How to invest in Bitcoin
Get started with Bitcoin Litecoin Ethereum AAVE USDC Stellar Ripple
Join Coinmotion and buy your first cryptocurrencies within minutes!
The views, thoughts, and opinions expressed in the text belong to the author and not necessarily to the author’s employer, organization, committee, or other group or individual.
