

The technical analysis of week 20 maps the past market week from a technical and fundamental point of view. We’ll find out why the 200-week moving average is a historically significant support level for bitcoin. In addition, we explore the market’s liquidity, realized price, and UTXO data. We also consider whether the central bank Fed’s interest rate hikes have reached their endpoint.
The 200-Week Moving Average and its Anomaly
The crypto market continues its sideways movement, with bitcoin battling short-term selling pressure. Nevertheless, the leading cryptocurrency has managed to hold on to its $27 000 level. The market still reflects the weakening of dollar liquidity, which may now be at its inflection point.
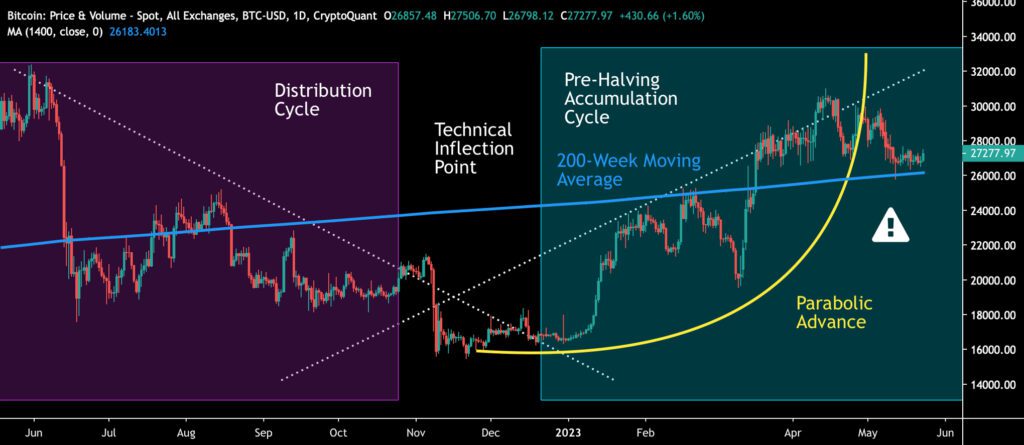
In April, bitcoin broke its parabolic advance (yellow), which it managed to follow for four months. Despite the parabola breaking, bitcoin is still gaining momentum from its turn-of-the-year technical inflection point (white). Additionally, the multi-year 200-week moving average (blue) acts as a support level for the cryptocurrency.
Sources: Timo Oinonen, CryptoQuant
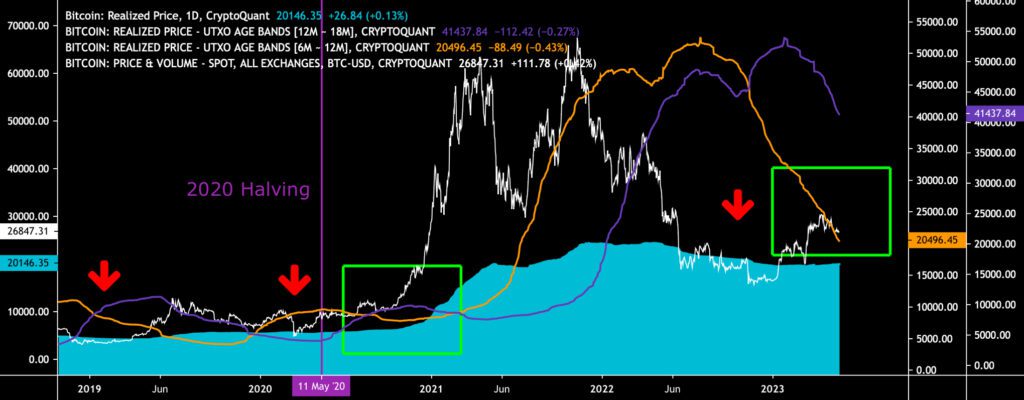
In the broader picture, bitcoin’s market behavior can be divided into accumulation (turquoise) and distribution phases (purple), forming a multi-year series of cycles. Institutional money has generally been active in accumulation cycles, while retail investors have preferred distribution cycles. The halving events that repeat every four years and the accumulation cycles that precede them determine the broader market outlook.
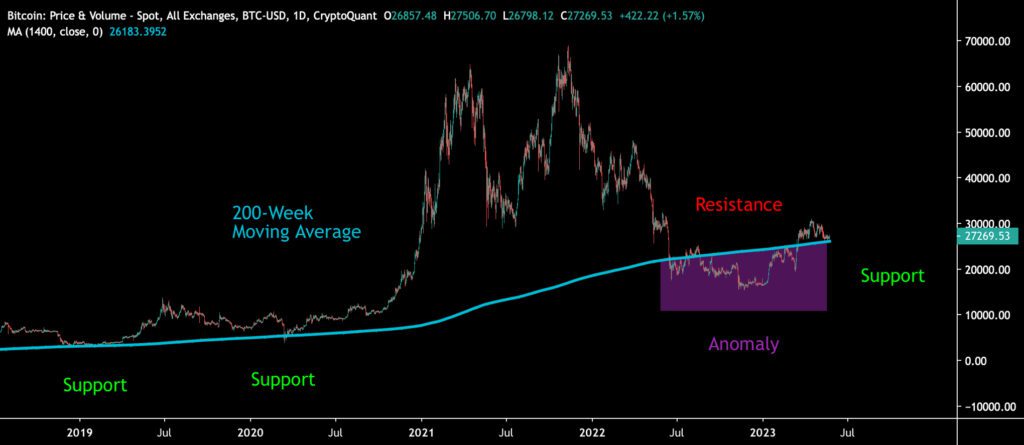
The 200-week moving average (turquoise) has served as bitcoin’s historical support level in 2015, 2019, and 2020 (green). The 2022 bear cycle was exceptionally deep, breaking below the moving average for the first time since 2015. The anomaly (purple) turned the market structure upside down, and the 200-week moving average became a resistance level for bitcoin (red). Keeping the spot price close to the moving average is now essential to preserve the market structure’s integrity.
Sources: Timo Oinonen, CryptoQuant
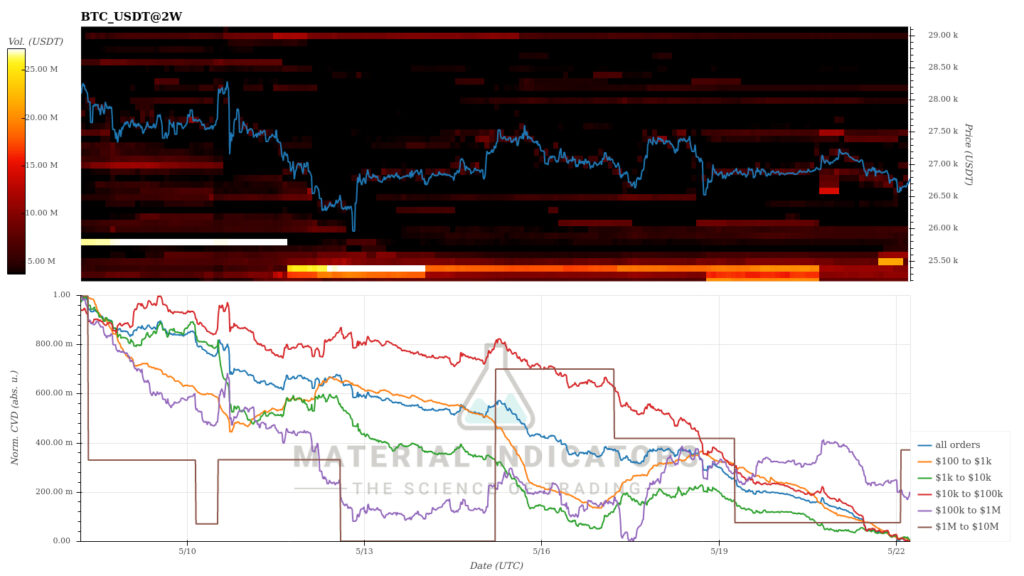
Material Indicators’ heat map shows that bitcoin’s $29-30K resistance level is clearly weakening. At the same time, the support level located at $25 000 will also weaken. The cumulative volume delta (CVD) shows that the market liquidity is still in a downward trend, although a moderate increase can be seen in whale-level transactions.
Source: Material Indicators
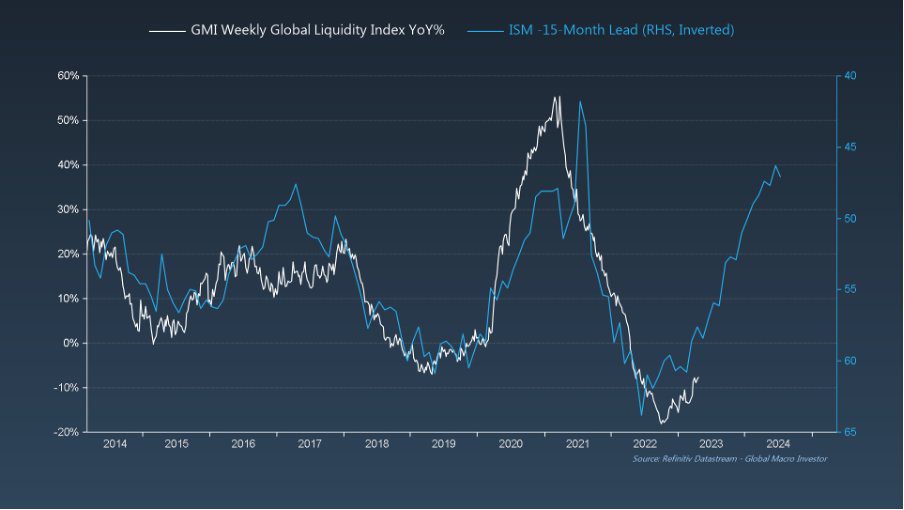
Investment strategist Raoul Pal systematically analyzes cryptocurrencies and the macro market outlook. Pal has been estimating that the central bank Fed will turn its hawkish monetary policy towards a dovish one in 2023. Pal sees the spot price of bitcoin as strongly correlated with the M2 monetary aggregate (i.e., the money supply). Bitcoin’s cyclical price development has historically risen as the money supply expands and fallen as the supply becomes scarcer.
Pal’s latest analysis describes the outlook of the purchasing managers’ index (15 months lead) rising towards 2024. Raoul Pal sees many investors as being poorly prepared for the change in the market environment. It is clear that a possible return to the QE line and an increase in liquidity would strengthen the position of high-beta risk assets.
Sources: Global Macro Investor, Raoul Pal
As mentioned, the price development of the crypto market has gone mostly sideways in the seven-day time window, with bitcoin strengthening by one percent and Ethereum by two percent. A notable exception is XRP, whose price development points to an upward angle of almost 10 percent. The positive trend can be interpreted as describing Ripple Labs’ winning ratio against the SEC. The S&P 500 has gained 1,7 percent in the week, and gold has weakened by 1,6%.
7-Day Price Performance
The Surface of Realized Price and UTXO
Bitcoin is still above its realized price (turquoise) after the almost 100 percent price rise in the spring, but the latest correction movement has brought the spot price closer to the realized price wave, which is now at $20 000. The realized price has been seen as a watershed in the market, representing the average price of all bitcoin purchases. At the same time, the spot that exceeded the realized price shows that bitcoin investors profit from their investments.
The spot price (white) and the 6M-12M wave of realized price (orange) form a 2020-like setup where the spot rises above the wave. The same phenomenon also happened during the 2019 summer correction. Historically, this setup has meant a bullish price cycle.
Sources: Timo Oinonen, CryptoQuant
A closer look at the realized price UTXO waves gives both good and bad news. Although the meeting of the spot price and the 6M-12M wave has been a positive technical signal, it also indicates the selling pressure of medium-term investors. In addition to the 6M-12M wave, 12M-18M is clearly falling.
The long-term 2Y-3Y wave represents a positive angle in the realized price UTXO data, as it has risen since November 2022. The 2Y-3Y wave represents the return of smart money accumulation, rising clearly in early 2023. 2Y-3Y sold at the peak of November 2022 and left the field for almost a year, now making a spectacular comeback.
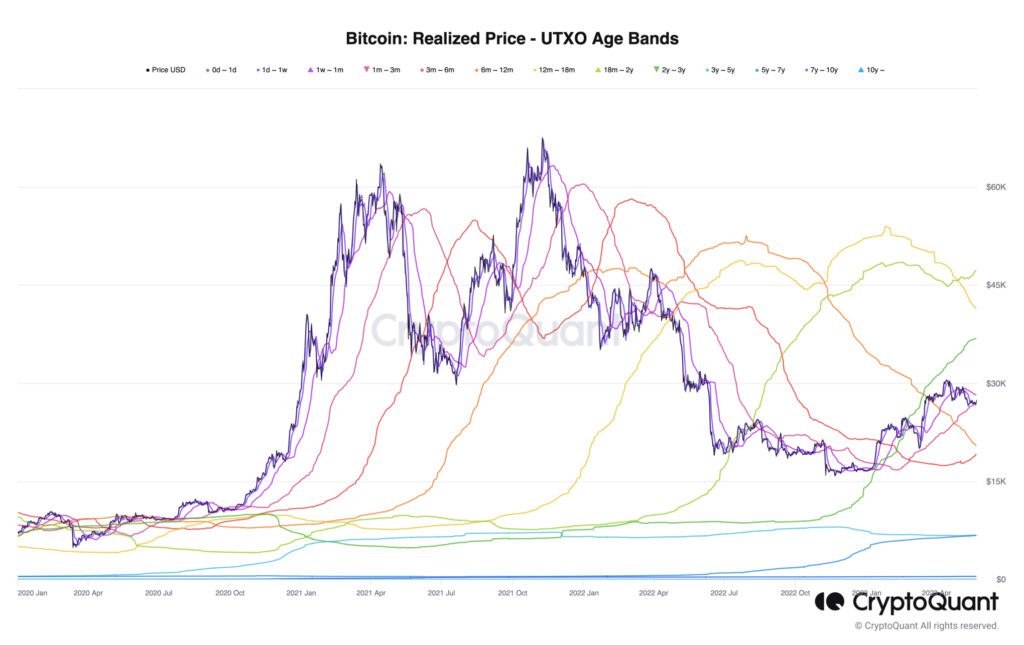
Source: CryptoQuant
A positive perspective is also represented by Cane Island Digital Research’s model, which forecasts bitcoin reaching at least $44 000 this year. The model mirrors the annualized price increases of bitcoin bull cycles, according to which the current “fifth” cycle would raise bitcoin by 127 percent. It is also worth noting that Cane Island, at the same time, argues that bitcoin’s boom cycles fade over time, which might be a controversial thesis.
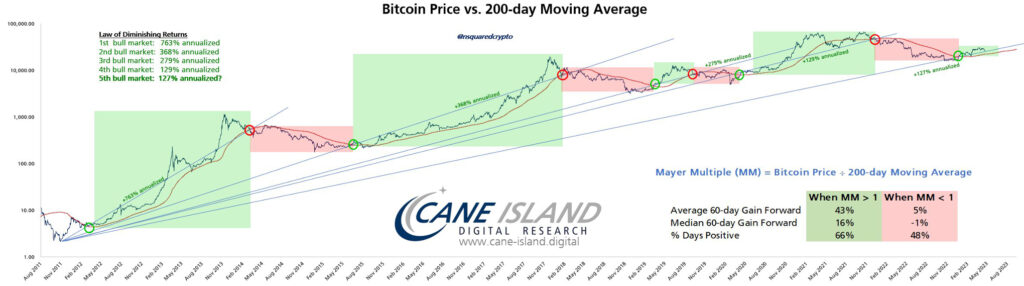
Source: Cane Island Digital Research
Litecoin Heating Up Before its Halving Event
Litecoin, which closely mimics the characteristics of bitcoin, is preparing for its halving in 70 days, or just over two months. Despite the correction at the end of spring, Litecoin has risen by almost 30 percent since the turn of the year and strengthened more than seven percent within a month.
The fact that the halving is approaching is also indicated by the clear increase in the number of active Litecoin addresses, climbing to 832 200 in mid-May. In January 2023, the number of active addresses was only a quarter of the current number. The addresses reflect the increase in network activity ahead of the halving event.
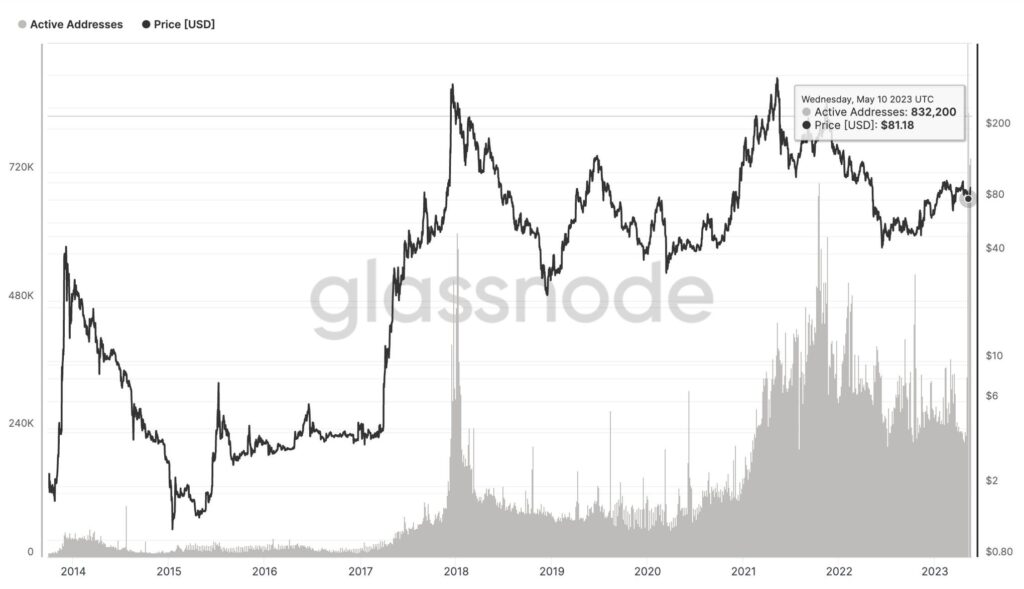
Source: Glassnode
Will the Fed’s Rate Hikes Finally End?
At the beginning of May, the central bank Fed announced its interest rate policy, which ended up with an expected increase of 25 basis points. At that time, the crypto market’s reaction to the interest rate decision was moderately positive. The next interest rate decision is again around the corner in June, this time likely leading to a turning point.
To counter escalating inflation, Fed gradually raised the interest rate throughout 2022 until the spring of this year. Interest rate hikes and quantitative tightening (QT) have significantly reduced dollar liquidity, making conditions difficult for high-beta asset classes. Speculative tokens with a small market value have especially suffered from tightening measures.
Despite everything, the interest rate peak is now in sight, while according to CME, almost 70 percent of investors believe that the Fed will stick to its achieved interest rate level. This is a real watershed in central bank policy, and it gives hope for a better investment environment. The Fed’s potential interest rate peak can be considered to be rocket fuel for the market(s).
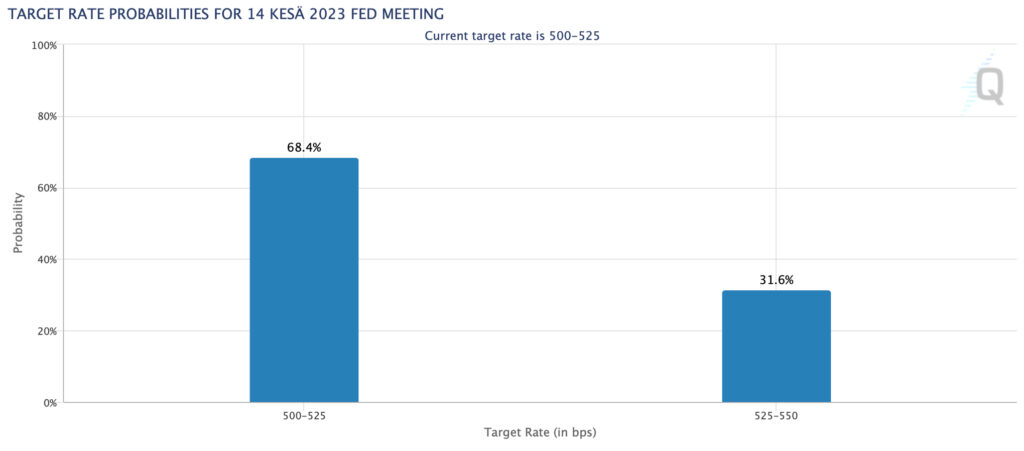
Source: CME
What Are We Following Right Now?
Solana adds an AI plugin to its smart contract platform. The first AI integrated into the L1 platform is based on ChatGPT and can be downloaded for free from GitHub.
Michael Saylor, known for his company MicroStrategy, sheds light on his latest thoughts on the Bitcoin market. According to Saylor, the credibility of the asset class has increased, while bitcoin is showing resilience amid the current banking crisis. Saylor describes himself as a “bitcoin realist,” not a “bitcoin purist.”

US Air Force Major Jason Lowery explains why Bitcoin can be seen as representing a new kind of digital warfare.

Stay in the loop of the latest crypto events
- Exploring altcoins updated meaning in 2023
- BRC20 tokens: How they differ from other cryptocurrencies
- Are We Approaching a V-shaped Correction?
- BRC20 tokens & Less Liquidity, More Volatility?
- Will the “Sell in May” Anomaly hit the Crypto Market?
- Bitcoin Still in Accumulation Cycle, Despite the Correction
- Exploring Ethereum’s Shapella upgrade: What you need to know
- How can decentralization save us in a world driven by AI?
- Beginner’s guide: How to invest in Bitcoin

The views, thoughts, and opinions expressed in the text belong to the author and not necessarily to the author’s employer, organization, committee, or other group or individual.