

The technical analysis of week 16 interprets the latest movements of the crypto market with the help of technical and fundamental instruments. We map, e.g., bitcoin’s correction and its triple bottom structure. In addition, TA argues why bitcoin is still in the accumulation cycle, despite the spot price weakness.
The mood of the crypto market has been slightly subdued during the past seven days, but by Wednesday, you can see clear optimism in the price movements of the leading cryptocurrency, bitcoin. Bitcoin has weakened by about 7 percent since last week, with the smart contract platform Ethereum weakening by more than -11%. In the background of Ethereum’s drop, you can see the negative “sell the news effect” after the Shapella (Shanghai + Capella) upgrade.
Read: Exploring Ethereum’s Shapella upgrade: What you need to know
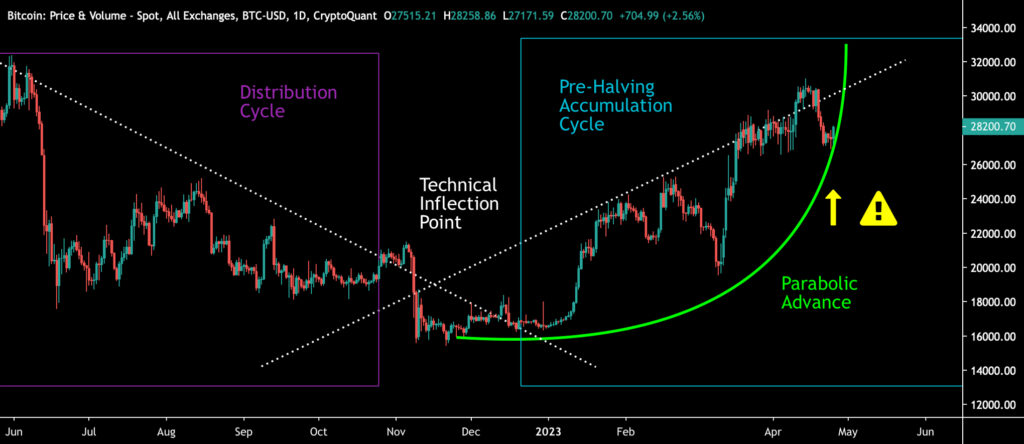
From a purely technical point of view, bitcoin passed its critical inflection point at the turn of the year, where the descending and ascending trend lines meet (white). The point acts as a watershed and defines the market from 2021 until the halving year of 2024.
At the same time, bitcoin has formed a parabolic trendline (green) from December 2022 until today, and the breaking of the green parabola from late spring would generate short-term selling pressure. The parabola is now steepening considerably, demanding a decisive price movement from bitcoin (yellow symbol). Bitcoin’s course jumped from the surface of the parabola in a textbook manner the night before Wednesday, but it remains to be seen whether the move will be enough to save the technical setup.
Sources: Timo Oinonen, CryptoQuant
Bitcoin is still strongly in an accumulation cycle (turquoise), looking at the 2024 halving, which is leading bitcoin toward higher price levels. The distribution cycle (purple), extending to 2021, ended at the end of 2022, marking the end of the long bear market.
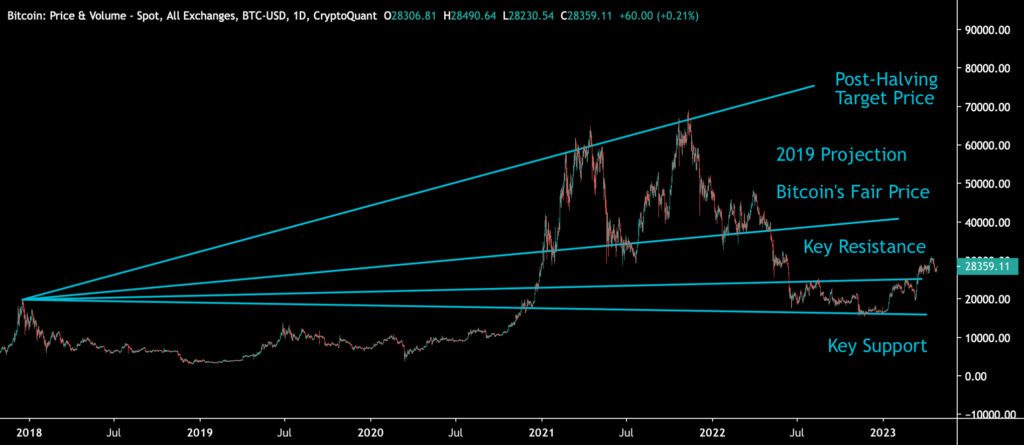
Bitcoin’s projection chart (below), derived from 2017, shows that the cryptocurrency has passed its main resistance level. Bitcoin is now heading towards its $42 331 “fair price” and our $46 092 target price.
Sources: Timo Oinonen, CryptoQuant
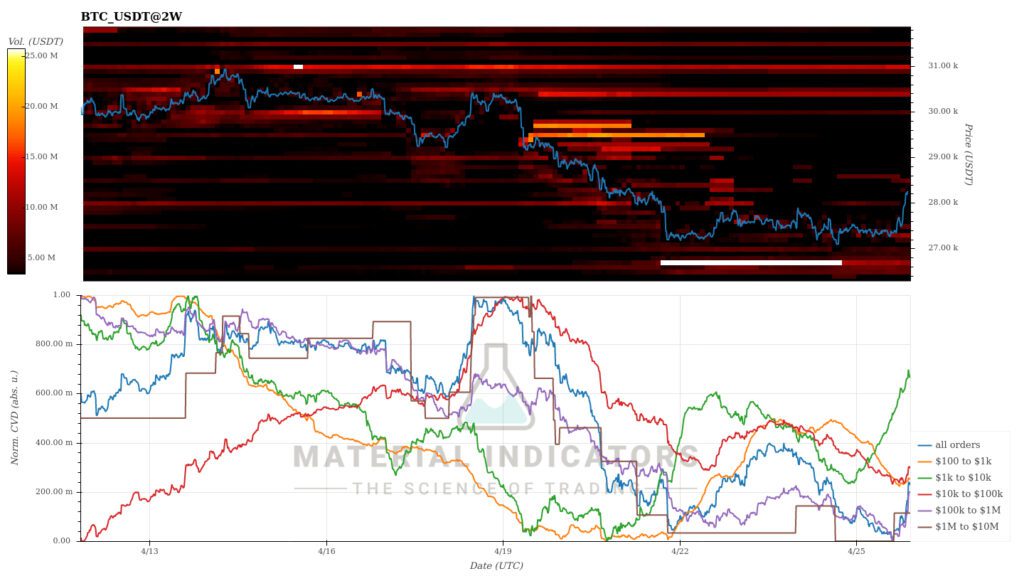
The Material Indicators heatmap shows how selling pressure drove bitcoin’s spot price down last week. Meanwhile, the heat map indicates a looming support zone below $27 000. Cumulative volume delta (CVD) indicates that market liquidity has risen to the level of mid-April, i.e., the highest reading in two weeks. At the same time, whales are clearly on the buying side.
Source: Material Indicators
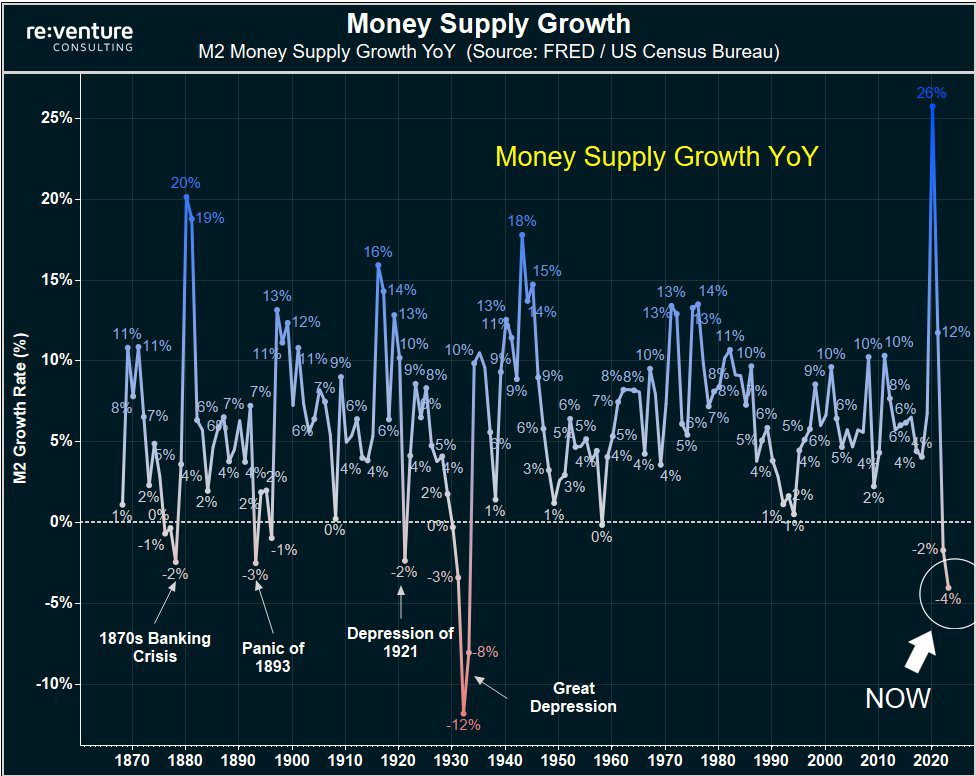
Bitcoin’s 70 percent price jump at the beginning of the year can be considered as a remarkable feat when you add the weakness of the macroeconomics to the equation. According to Reventure Consulting, the central bank Fed continues to tighten the economy at a record-breaking rate, reducing the money supply the most in 90 years. The contraction of the M2 monetary aggregate was in similar numbers for the last time in the 1930s.
Source: Reventure Consulting
Although the weekly price development has been clearly subdued, bitcoin managed to rise from the level of $27 000 to the level of $28 000 in a day, climbing three percent. In the time window of a week, bitcoin has sunk by about seven percent. Following the general correction rules, higher beta tokens have suffered significantly more than bitcoin, with Chainlink and Uniswap down nearly 15 percent in a week. The correlation between bitcoin and small-cap tokens remains strong.
The mainstream stock index S&P 500, is down a couple of percent from last week, and gold weakened by -0,4% from last week.
7-Day Price Performance
Active Addresses Rising after the Triple Bottom Structure
The triple bottom structure of active addresses, presented in the previous TA of week 9, is clearly coming to fruition. On-chain data shows how the number of active addresses (30-day weighted moving average) generated three individual price bottoms in 2018-2019, and the current 2021-2023 cycle is creating a similar structure.
We can observe how the number of active addresses started to decline already in the summer of 2021, effectively acting as a leading indicator of the spot price. Therefore, the price development of spring 2021 can be considered a de facto peak supported by fundamentals, while the peak of November 2021 can be considered “secondary.”
In addition to the triple bottom structure, the number of active addresses (blue) is increasing, mirroring Bitcoin’s increasing network activity. Together, these factors allow the spot price to rise gradually in 2023.
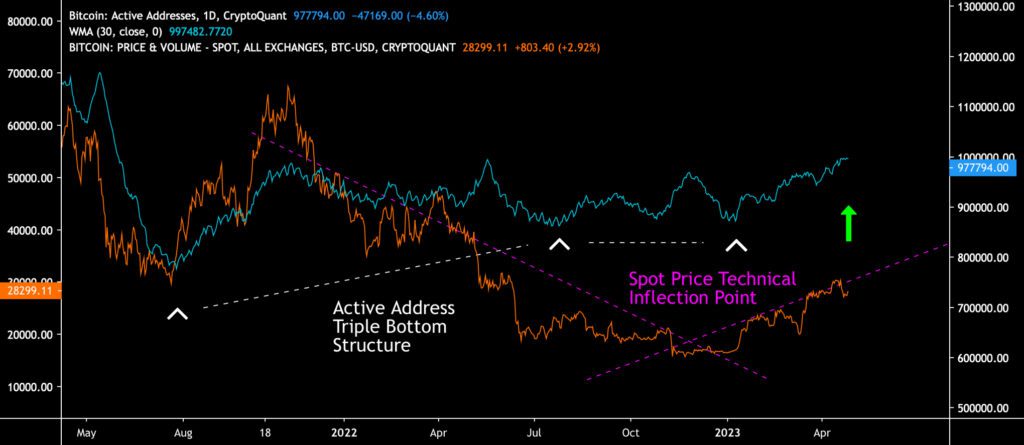
Sources: Timo Oinonen, CryptoQuant
The Accumulation Cycle Still Intact, Despite the Recent Correction
Bitcoin has moved into a -10 percent correction after ascending almost 100 percent during early 2023. While the price action looks bad, traders should still remember to stay calm.
From a purely technical point of view, bitcoin passed its critical inflection point at the turn of the year, where the descending and ascending trend lines met (black). The point acts as a technical watershed and defines the market from 2021 until the halving year of 2024.
In early 2023, bitcoin has been able to rise above the realized price (grey) indicator. The realized price is important because it represents the average price of all bitcoin purchases. At the same time, the realized price illustrates that average bitcoin buyers are making a profit on their investments.
In the broader picture, bitcoin’s market behavior can be segmented into accumulation (turquoise) and distribution (purple) phases, which together form a multi-year series of cycles. Institutional money has traditionally favored accumulation cycles, while retail investors have been active in distribution cycles. Bitcoin’s history is also defined by halving events, which are always preceded by a pre-halving accumulation cycle (turquoise).
Despite the falling spot price, bitcoin’s exchange stablecoin ratio (yellow, ESR) is currently acting as a leading indicator to bitcoin and other digital assets in correlation. The ESR and bitcoin’s spot price converged from 2021 to 2022. However, last year’s selling pressure broke their correlation. Pivoting its path back in late 2022, the exchange stablecoin ratio is again reaching towards new highs. In the current market structure, ESR acts as a magnet to bitcoin’s spot price.
As an epilogus, bitcoin’s market structure is still supported by multiple technical and on-chain factors. The multi-year inflection point backs bitcoin technically. Additionally, the leading cryptocurrency is supported by realized price, growing ESR divergence, and pre-halving accumulation cycle.
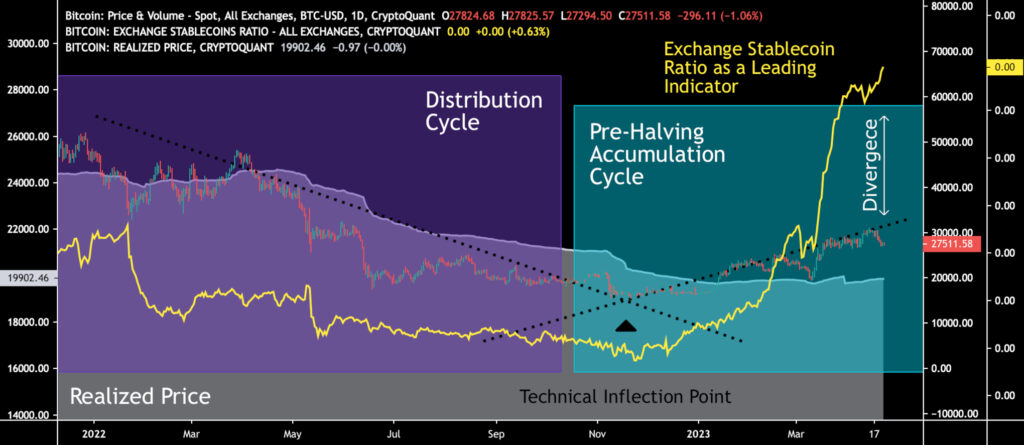
Sources: Timo Oinonen, CryptoQuant
MVRV Indicator Reaching 11-Month Highs
The MVRV indicator, which describes Bitcoin’s valuation level, has risen to the level of 1,38, representing the highest reading in 11 months. MVRV dropped well below one last fall and reached its lowest reading of 0,76 in November 2022 amid the selling pressure.
The low MVRV numbers at the end of the year reflected the undervaluation of bitcoin, and the downward MVRV trend simultaneously depicted the selling pressure reaching its saturation point. At the same time, the realized value of bitcoin exceeded the market value, reducing incentives to sell.
The MVRV indicator is calculated by dividing Bitcoin’s market value by the realized market value and was developed by David Puell and Murad Mahmudov in 2018. The Puell Multiple, which has been involved in technical analyses, is also named after David Puell. Bitcoin is considered overvalued when MVRV exceeds 3,7, and correspondingly, MVRV indicates bitcoin is undervalued when it falls below 1.
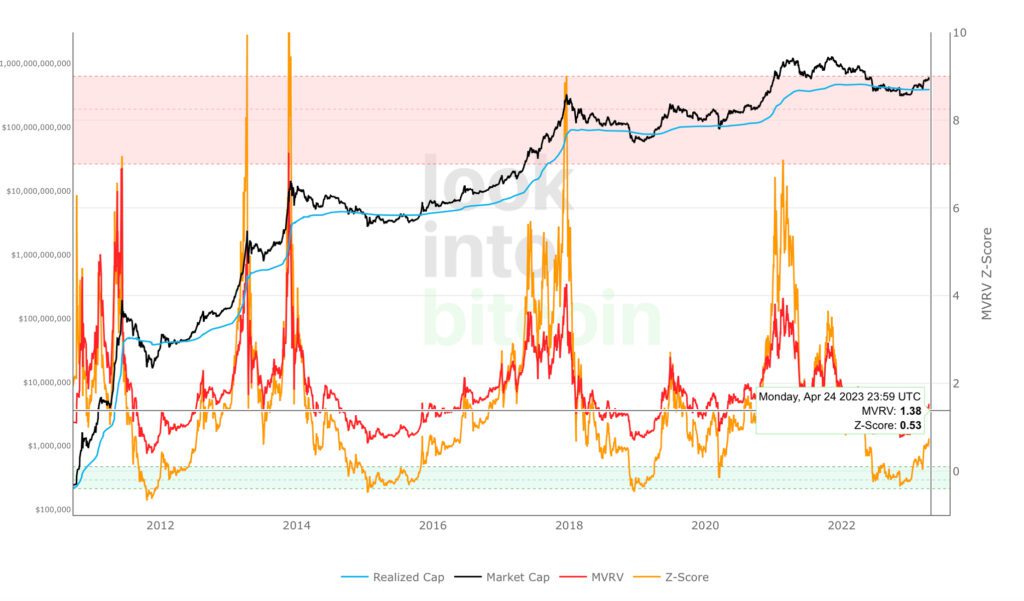
Source: LookIntoBitcoin
Focus on Fed’s FOMC Next Week
The central bank Fed’s FOMC meeting will be held again on May 3rd, i.e., in about a week. Investors continue to closely monitor the liquidity situation and interest rate policy of central banks, whose impact on high-beta cryptocurrencies is particularly pronounced. At the same time, regional differentiation can be seen in the policies of the central banks, with the western ones pursuing stricter policies and the central banks of Asia inclined to stimulus.
According to CME data, 76,7 percent of investors believe the Fed will end up raising interest rates by 25 basis points, while 23,3% of investors believe interest rates will remain unchanged. The Fed’s hikes are clearly reaching their peak, as the increases at the turn of the year were still at 75 basis points.
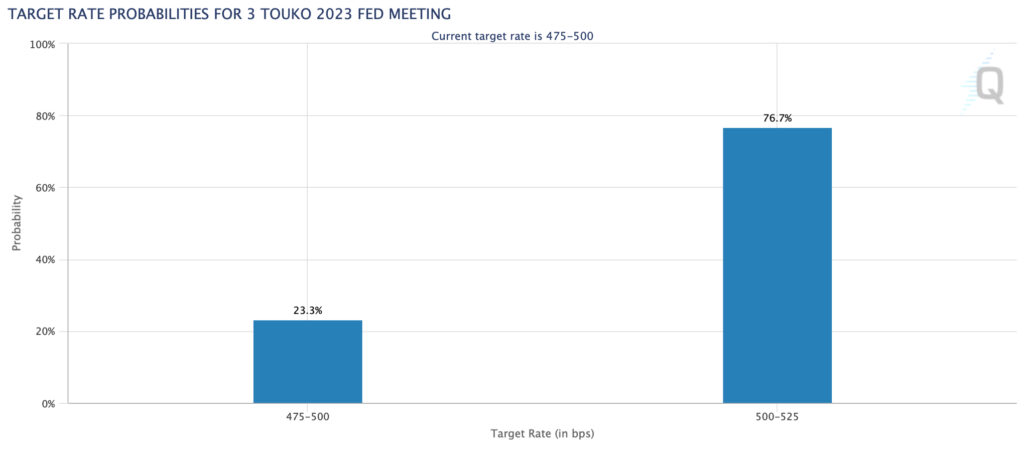
Source: CME
Some US analysts, such as Luke Gromen, have long speculated that the Fed will turn its monetary policy from quantitative tightening (QT) to easing (QE). However, the change of QT to the QE line is just a projection for the time being. A sudden return to the QE and an increase in liquidity would definitely strengthen the position of high-beta risk assets.
Investment strategist Raoul Pal has been analyzing cryptocurrencies and the macro market outlook. Pal estimated previously that the central bank Fed would turn its hawkish monetary policy towards a dovish one in 2023. Pal sees the spot price of bitcoin as strongly correlated with the M2 monetary aggregate (i.e., the money supply). Bitcoin’s cyclical price development has historically risen as the money supply expanded and fallen as the supply became scarcer.
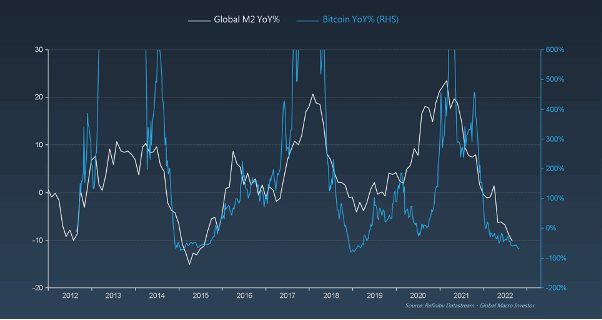
Sources: Raoul Pal, GMI
What Are We Following Right Now?
As the US regulatory environment tightens, the European Union appears even more attractive to blockchain industry companies. According to Nathaniel Whittemore, the EU’s MiCA may even provide a framework for global crypto regulation.

Coinbase exchange, which has been caught by the US Securities and Exchange Commission SEC, has acquired a license to operate in Bermuda. The exchange has turned its eyes to offshore operations after the SEC accused it of, e.g., selling unregistered securities. Coinbase’s stock (ticker: COIN) has recently weakened as regulatory risk grows.

Are the central bank policies at the end of their road? According to Weston Nakamura, the Bank of Japan (BoJ), which has implemented a radical stimulus for decades, has now backed itself into a corner.

Stay in the loop of the latest crypto events
- Exploring Ethereum’s Shapella upgrade: What you need to know
- Beginner’s guide: How to invest in Bitcoin
- Bitcoin Breaks the $30 000 Key Resistance Level & Ethereum’s Shanghai Upgrade
- How can decentralization save us in a world driven by AI?
- The Market Reflects Tightening Regulatory Environment
- What has happened in the crypto market in Q1 — and what is to come?
- Why is Bitcoin rising in 2023?

The views, thoughts, and opinions expressed in the text belong to the author and not necessarily to the author’s employer, organization, committee, or other group or individual.