

The technical analysis of week 14 dives into the most relevant technical indicators, such as Bollinger bands and the Material Indicators heat map. At the same time, we strive to apply Hyman Minsky’s teachings to the crypto market. In addition, we map the derivatives market, realized price-derived models, and the thesis of $100 000 bitcoin.
Applying Minsky’s Theories to the Crypto Market
A clearly positive momentum can be observed in the crypto market compared to last week, with the leading cryptocurrency, bitcoin breaking through its critical $30 000 resistance level. The market is now showing palpable optimism and a desire to rise toward higher price levels.
In a technical sense, bitcoin passed its inflection point, formed by rising and falling trendlines at the turn of the year, after which bitcoin’s momentum has been strong, pulling the cryptocurrency up 83 percent year to date. After the previous expansion phase, the Bollinger bands (purple) are now squeezing the spot price of bitcoin, anticipating an upward price movement. Before the breakthrough, the BB indicator was at its narrowest since early February.
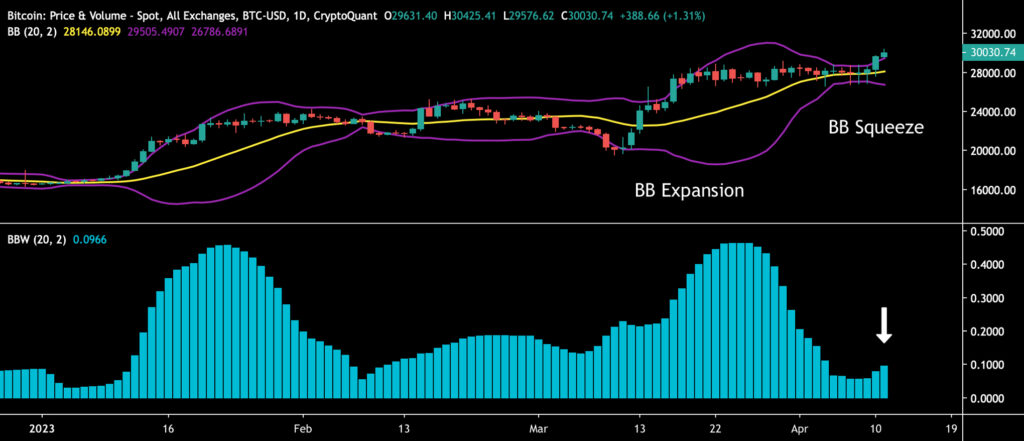
Sources: Timo Oinonen, CryptoQuant
Since the beginning of March, bitcoin has remained in its rising technical channel (pink), within which the spot price oscillates. From a broader perspective, the channel points towards bitcoin’s “fair price” of 40 566 dollars.
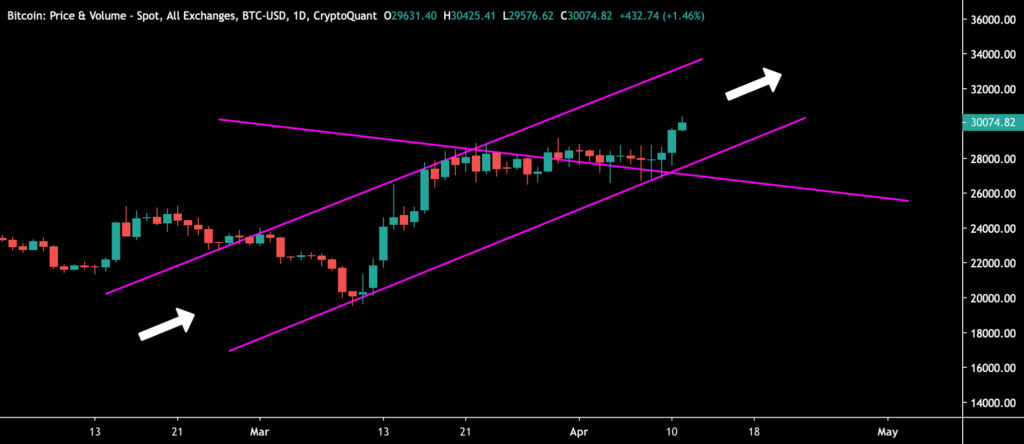
Sources: Timo Oinonen, CryptoQuant
According to the Material Indicators’ heat map, the $29 000 resistance zone was adamant in early April, but bitcoin has now clearly broken it. The heat map seems to offer the spot price a path toward higher levels. According to the heat map, there is a relatively weak support level at the $27 000 level.
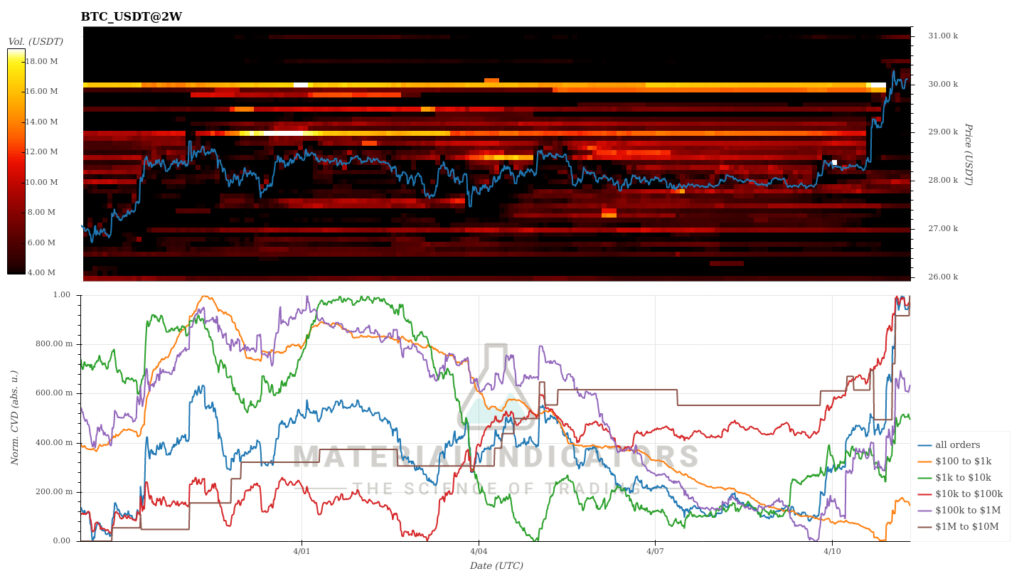
Source: Material Indicators
In the middle of the changing market environment, it is good to remember the teachings of the American economist Hyman Minsky. According to Minsky, stability leads to instability, because the market never remains in a static state. Minsky’s principle can be applied to the Bollinger bands and bitcoin’s technical setup, which predict increasing volatility.

Source: Hyman Minsky
The leading cryptocurrency broke its critical resistance level of $30 000 at the beginning of the week and has climbed to an 8,4 percent rise at the same time. As a decentralized finance platform Ethereum clearly correlates with bitcoin, rising 6,2 percent in a week. The other “altcoins” listed by Coinmotion have not yet gained traction with bitcoin, with the exception of Aave.
Bitcoin’s weekly uptrend clearly contrasts with the stock market, whose S&P 500 index has weakened by -0,4 percent in the week. While bitcoin has risen by 83 percent since the beginning of the year, the S&P has strengthened by a relatively modest 7 percent in 2023.
Seven Day Price Performance
The Derivatives Market is Approaching a Short Squeeze
The amount of open interest (OI) in the bitcoin derivatives market has reached a new record of 9,5 billion dollars in 2023. As recently as mid-March, OI hovered at $5,9 billion, thus rising 61 percent in less than a month.
But what then increases the number of open interests? The simplest explanation is the growing number of long positions in the derivatives market, with investors believing that bitcoin will continue its price rise. However, the escalating number of long positions increases the risk exposure because a collapse of the spot market could liquidate a huge number of long positions at once.
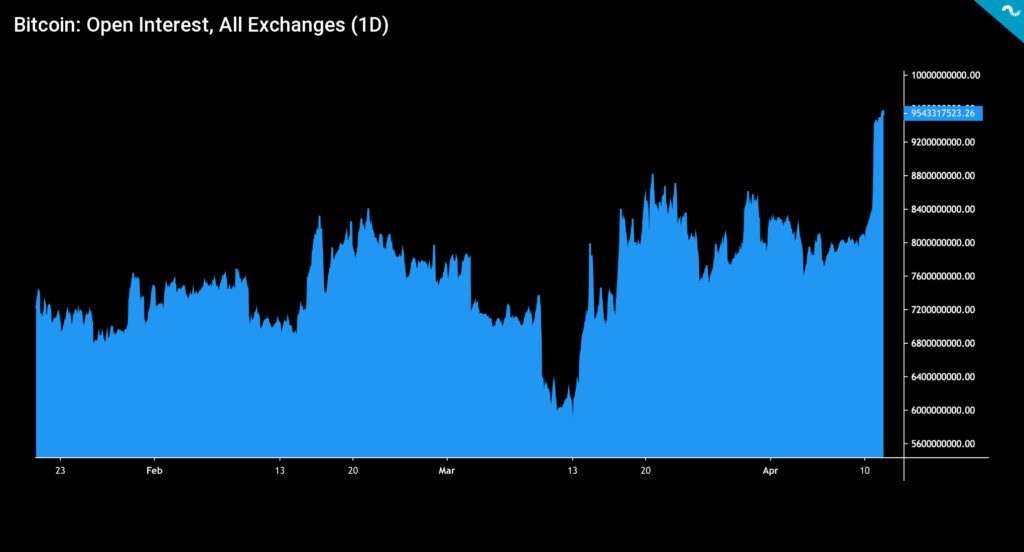
Sources: Coinmotion Research, CryptoQuant
Coinglass’ data shows that the liquidation of short positions is increasing. The bitcoin market is still heavily shorted, so the rise in the spot price may create a short squeeze setting for unlucky speculators.
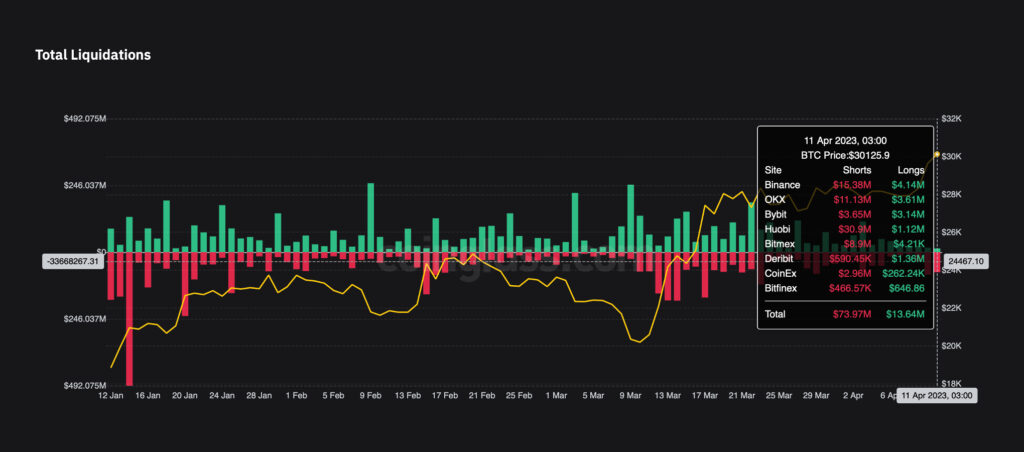
Source: Coinglass
The realized price UTXO waves have shown the market bottom of bitcoin for many years. In 2019, the decline of the 6M-12M wave (orange) below the 12M-18M wave (purple) (utxo cross) indicated a market bottom. The same structure was realized again in 2020. Additionally, the phenomenon was repeated at the end of 2022, when 6M-12M clearly sank below 12M-18M, while their divergence increased. The meeting of the UTXO waves at the end of 2022 can therefore be seen as confirming the market bottom.
Now bitcoin has risen significantly above the realized price, approaching the situation of early 2022. At the same time, the bitcoin spot price is moving towards the orange realized price 6M-12M wave (green area on the right), touching the wave for the first time since 2021 (green area on the left) in the coming days.
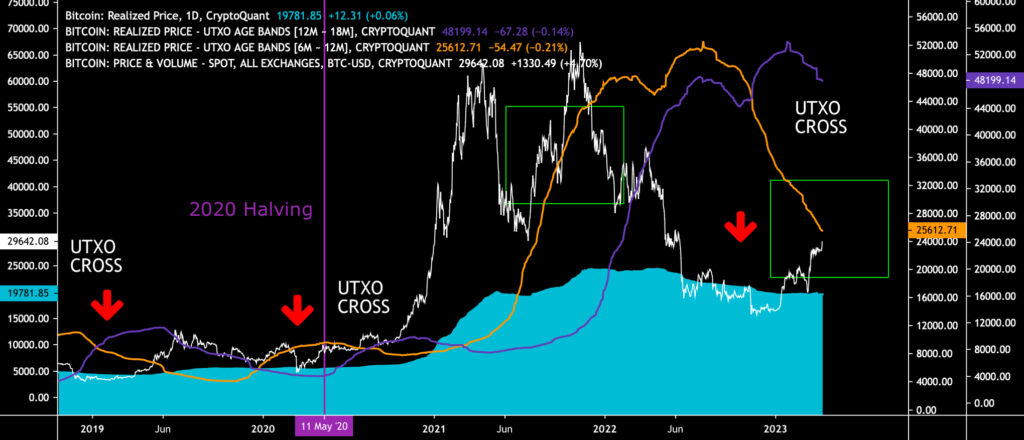
Sources: Timo Oinonen, CryptoQuant
An On-Chain Thesis for $100K Bitcoin
The leading cryptocurrency bitcoin has been offering exceptional returns during early 2023, climbing 69 percent year-to-date. Praeterea, the correlation between bitcoin and the technology-related index Nasdaq 100 has weakened, dropping -60 percent from October’s 0,75 to the current value of 0,3.
In the bigger picture, bitcoin’s market behavior can be segmented into accumulation (turquoise) and distribution (purple) phases, which form a multi-year sequence of cycles.
Accumulation cycles have been favored by smart money (institutions), while distribution cycles have been characterized by retail demand. Bitcoin’s history is also dominated by halving events, which are preceded by pre-halving accumulation cycles (turquoise).
The shift from accumulation to distribution cycle can be forecasted by fees to reward on-chain data (yellow), which tends to spike before each distribution cycle. The phenomenon occurred in 2019 and 2020.
In the accumulation cycle of 2019, the fees-to-reward ratio spiked before the summer relief rally (white arrow on the left), rising to 0,12. In 2020, the fees to reward ratio spiked again, first reaching 0,21 in May and 0,29 later in November.
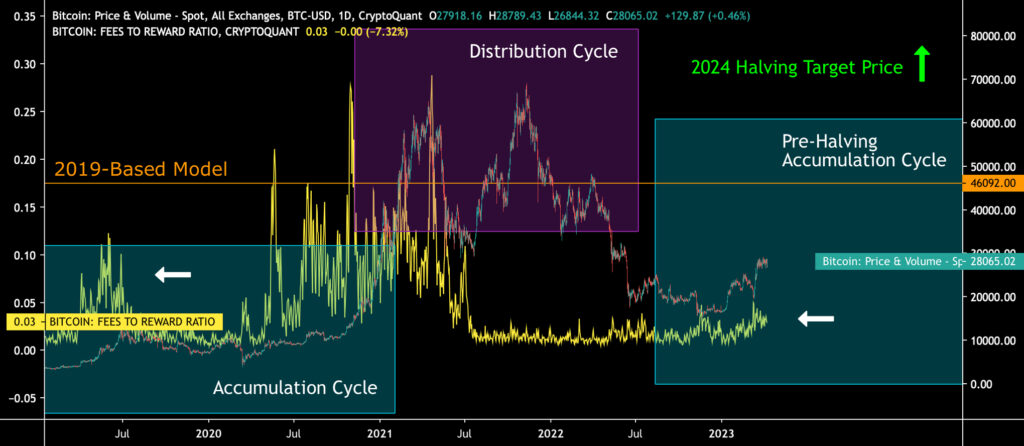
Sources: Timo Oinonen, CryptoQuant
The fees to reward indicator seems to be spiking again (white arrow on the right). Additionally, bitcoin is moving towards my earlier 2019-based price model, which forecasts a 46 092 dollar spot price level. According to the model, bitcoin should reach its target during the upcoming summer of 2023.
However, the real target is the halving event of 2024, which also represents a paradigm shift in the sequence of bitcoin’s market cycles. The estimated date for bitcoin’s next halving event is 29.4.2024, and it will increase the scarcity of the cryptocurrency by dropping the block reward from 6,25 to 3,125. After reaching the 2019-based target price of 46 092 dollars, it’s easy to see bitcoin reaching $100 000 in the aftermath of the 2024 halving event.
MicroStrategy’s Purchases Above the Break-Even Point
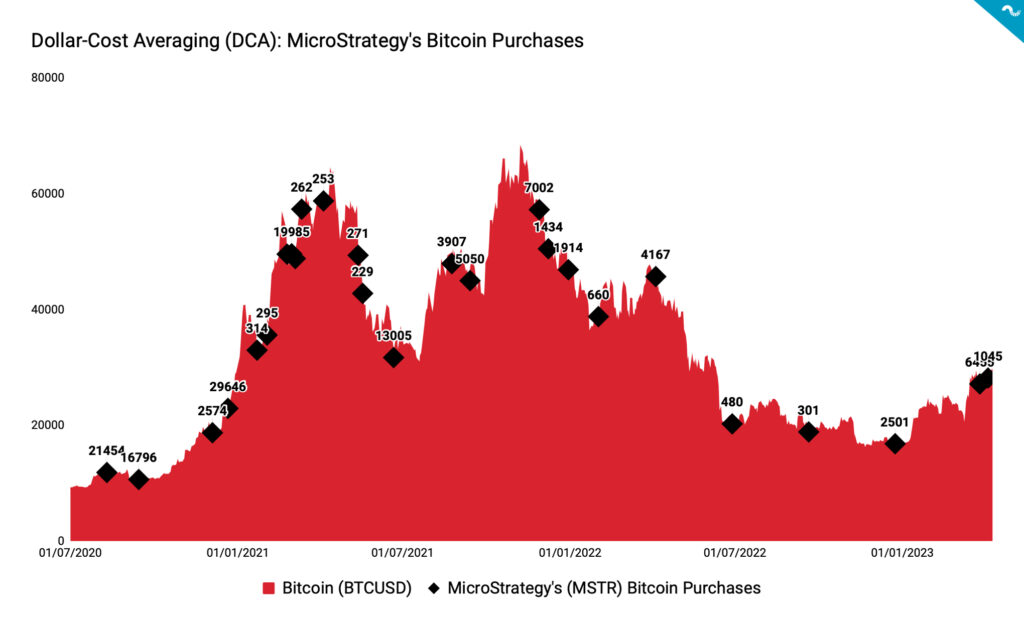
Michael Saylor recently announced that MicroStrategy (MSTR) acquired 1045 new native bitcoin units, bringing its total balance to 140 000 bitcoins. MicroStrategy’s bitcoin holdings are now worth about $4,17 billion and were acquired at an average price of $29 803. The share price of MicroStrategy (MSTR) was highly correlated with the price of bitcoin in the second half of 2020 (H2), but the correlation weakened in 2021. When the spot price of bitcoin rose to its second peak in the 2021 double-peak structure, MSTR no longer followed the same correlation.
Now in the spring of 2023, MSTR and BTC are again correlated with the company’s stock rising 130 percent since the beginning of the year, while Bitcoin has reached an 83 percent rise. At the same time, Bitcoin’s recent breakout through the $30 000 resistance zone means that MicroStrategy is well above its $29 803 break-even point.
Source: Coinmotion Research
Michael Saylor and MicroStrategy, which he founded in 1989, have profiled themselves as pioneers in institutional bitcoin investing. The company’s turning point occurred in July 2020, when Saylor announced that it would replace the company’s dollar holdings with bitcoins and alternative assets. Saylor is also known for his bitcoin theses, which include defensive, opportunistic, and strategic arguments.
The attached chart, created by Coinmotion Research, gives an overall picture of MicroStrategy’s bitcoin acquisitions. As the chart shows, the company accumulated very actively in 2020 and 2021, but during 2022 the purchases remained modest. MicroStrategy has been seen as an indicator of institutional appetite, and the purchases in Q1 can be seen as a sign of a broader market recovery. Players like MicroStrategy are the first to increase their bitcoin exposure after an inflection point, and the MSTR stock can be seen as a leading indicator of the market.
Market Impact of Ethereum Shanghai (Capella) Upgrade
The market reaction to Ethereum’s Shanghai update, which was just recently activated on Wednesday, 12.4, worries investors at the moment. The Shanghai update, also called EIP-4895 and Capella, gives Ethereum stakers the long-awaited opportunity to claim their tokens. Moving to the Proof-of-Stake protocol allowed the staking of ether tokens, but the funds were locked for an indefinite period of time before the Shanghai update.
There are different estimates of the Shanghai update’s market effect depending on the source. CryptoQuant Research estimates that Ethereum’s selling pressure will remain lower than expected, while the rise of the ETH/BTC pair indicates that ethereum is performing better than bitcoin. According to CryptoQuant, staking accounts for about 14 percent of Ethereum’s supply.
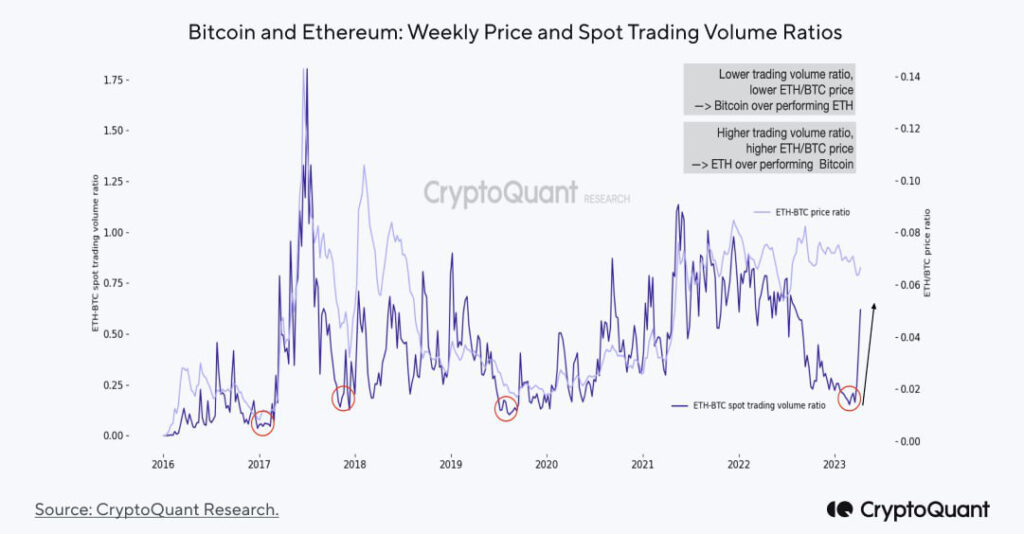
Source: CryptoQuant Research
At the same time, Glassnode has published its own estimates of the Shanghai update’s market effects. Glassnode has segmented its forecast into three different scenarios, the worst of which is that 1,54 million ether tokens will be released to the market, worth $2,93 billion. According to Glassnode’s moderate scenario, 312 000 ether tokens would be released to the market, and according to the most positive scenario, 170 000 tokens.
Although Shanghai generates market volatility in the short term, its overall long-term effect is positive. The update will uplift the development of Ethereum and adds liquidity to its staking. In addition to the Shanghai upgrade, the market will be swayed by the latest CPI release on Wednesday.
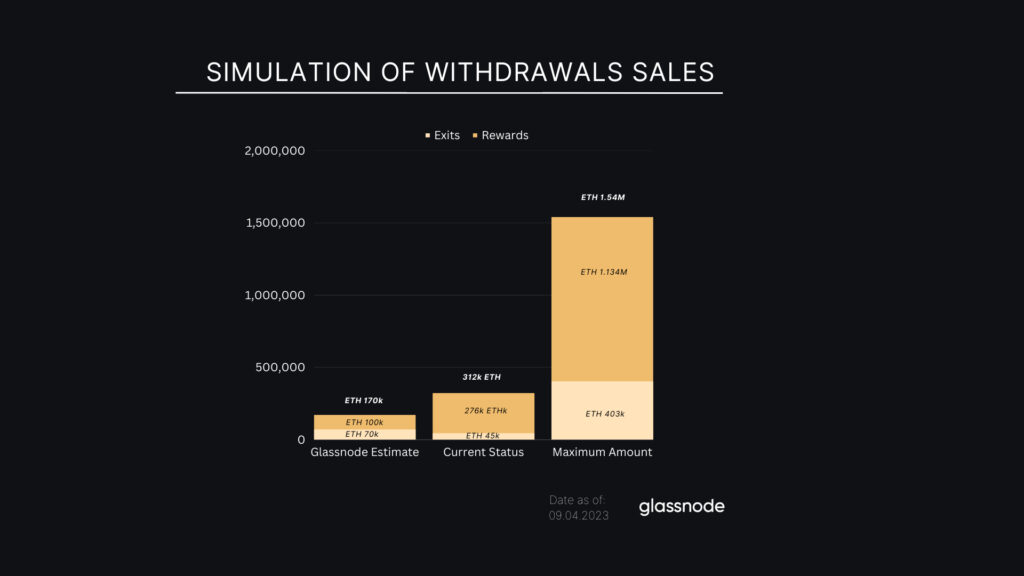
Source: Glassnode
What Are We Following Right Now?
Cathie Wood of ARK Invest, the company focused on disruptive technology, walks through Balaji Srinavasan’s Million Dollar Bitcoin Scenario. According to his original prediction in March, Balaji estimated that bitcoin would rise to one million dollars within 90 days, mainly fueled by hyperinflation. The time window is probably optimistic, but as a long-term price forecast, Srinavasan’s estimate is valid.

Lyn Alden opens up about her views on the banking crisis and the possibility of a repeated 2008-style financial crisis.

An episode of ARK Invest’s Big Ideas series talks about digital wallets and how they offer an alternative to traditional bank accounts.

Stay in the loop of the latest crypto events
- How can decentralization save us in a world driven by AI?
- The Market Reflects Tightening Regulatory Environment
- What has happened in the crypto market in Q1 — and what is to come?
- MicroStrategy as Market’s Leading Indicator
- Why is Bitcoin rising in 2023?
- Bitcoin Retains its Momentum Amid the Chaos
- Aave launches native stablecoin GHO
- New Bitcoin NFTs spark discussion — What are Bitcoin Ordinals?
- EUROe stablecoin — First EU-regulated stablecoin launched in Finland | Interview with Juha Viitala

The views, thoughts, and opinions expressed in the text belong to the author and not necessarily to the author’s employer, organization, committee, or other group or individual.