

The technical analysis of week 12 delves into the triple bottom structure of bitcoin and its importance for the direction of the spot price. In addition, we assess the exchange stablecoin ratio (ESR) and investment products of digital assets. We also go through the MicroStrategy company’s balance sheet and the competitive landscape of the stablecoin market.
The Triple Bottom Structure of Bitcoin’s Active Addresses
The price development of the crypto market has continued to be moderately weak since last week, with bitcoin weakening by around -3 percent. Market sentiment is weighed down by the tightening regulatory environment in the US, which makes it especially difficult for exchange platforms to operate. In March, the state of New York sued the well-known KuCoin exchange, and the American local operator Coinbase has also been targeted. In the latest twist, the Commodity Futures Trading Commission (CFTC) has strongly accused the Binance exchange and its leader Changpeng Zhao (CZ).
Despite everything, bitcoin’s technical setup still looks positive, while well-known analyst and options trader Tone Vays sticks to his 100 percent bitcoin allocation. The leading cryptocurrency surpassed its technical inflection point (pink), marking a paradigm shift. The spot price is now trending toward its $38 957 “fair price” and the $46 092 price target, based on our 2019 model presented in February.

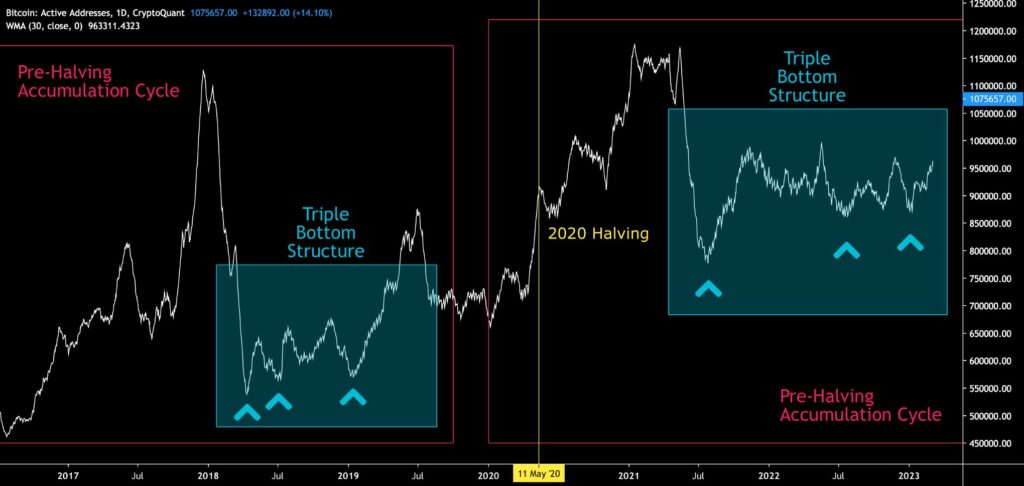
Bitcoin’s number of active addresses seems to repeat their 2018-2019 triple bottom structure. On-chain data shows how the number of active addresses (30-day weighted moving average) generated three individual price bottoms in 2018-2019, and the current 2021-2023 cycle is creating a similar structure. We can observe how the number of active addresses started to decline in the summer of 2021, effectively acting as a leading indicator of the spot price. Therefore, the price development of spring 2021 can be considered the de facto peak supported by fundamentals, while the peak of November 2021 can be regarded as “secondary.”
In summary, if bitcoin follows the triple bottom structure of the last major cycle, we will see a gradual price increase through 2023. Bitcoin is now in a pre-halving accumulation cycle and looks toward 2024.
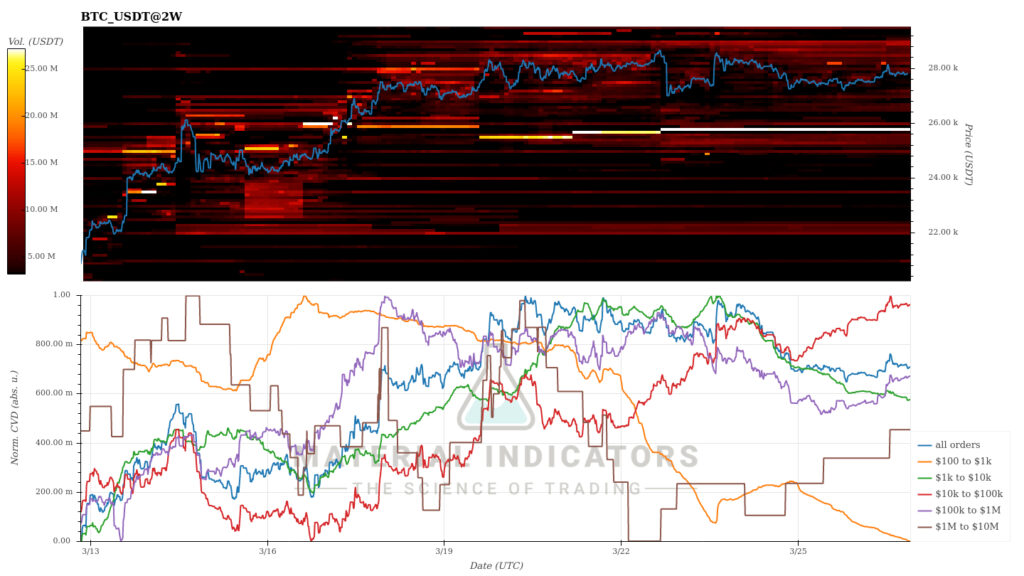
The Material Indicators heat map shows that bitcoin has pierced a significant number of resistance levels during its recent up cycle. If the spot price now corrects moderately downward, the next significant support level can be slightly below $26 000. A correction would provide bitcoin with more momentum.
The last seven days have pushed the crypto market into a moderate decline, with a few exceptions. Bitcoin and Ethereum, the leading cryptocurrencies by market cap, are each down a few percent, while higher-beta tokens are seeing more downside. Litecoin and XRP have drifted into a positive price trend, the former of which will meet its halving event in 126 days. XRP investors, on the other hand, are waiting for the outcome of the legal battle with the SEC. Event-driven trading tactics can therefore be applied to both Litecoin and XRP.
The S&P 500 index has weakened by about one percent since last week, and gold has strengthened by a modest -0,2%.
7-Day Price Performance
The Exchange Stablecoin Ratio Indicates Bullish Momentum for Bitcoin
Early 2023 has been exceptionally successful for bitcoin, but at the same time, the volatility of the market has increased. The spot price of bitcoin (turquoise) sank below the realized price (purple) wave in 2022 but has stayed above it since the turn of the year. The recent dramatic market volatility is reflected in bitcoin’s relation to its realized price, from which the spot price rebounded strongly on March 10th. Now the spot has already reached the level of May 2022, clearly turning away from the realized price surface.
The realized price has been seen as the market’s watershed, representing the average price of all bitcoin purchases. At the same time, the spot exceeding the realized price shows that bitcoin investors profit from their investments.
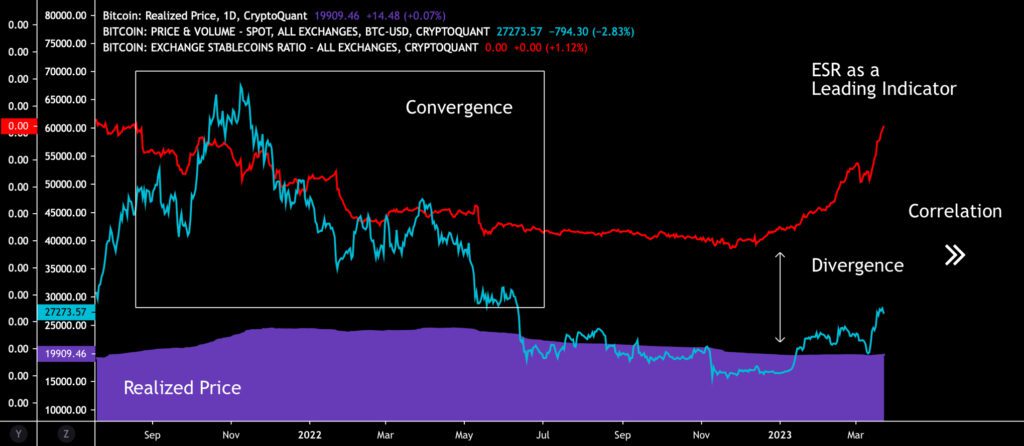
Praeterea, the exchange stablecoin ratio (red, ESR), is currently acting as a leading indicator to bitcoin and other digital assets in correlation. The ESR and bitcoin’s spot price converged from 2021 to 2022. However, last year’s selling pressure broke their correlation.
Pivoting its path back in late 2022, the exchange stablecoin ratio is again reaching new highs. In the current market structure, the ESR acts as a magnet to bitcoin’s spot price, and their divergence will shift into a convergence over time. I expect these two indicators to be more correlated in the future as bitcoin moves forward in its pre-halving accumulation cycle.
The Banking Crisis Uplifts the Popularity of Digital Assets
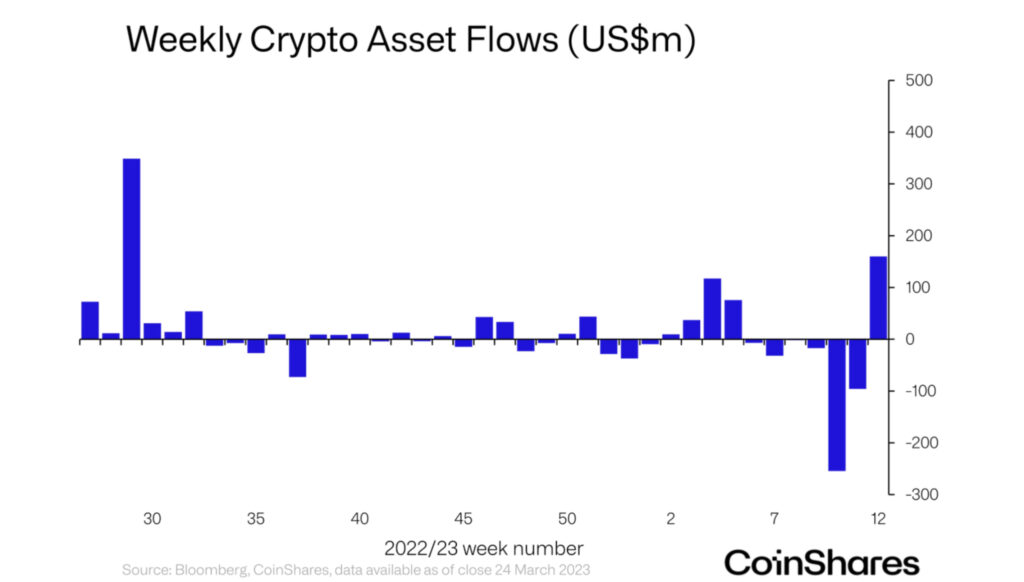
According to CoinShares data, digital asset investment products saw inflows of $160 million in a week, representing the most extensive market movement since July 2022. The considerable inflow also indicates a market in transition after six negative weeks and outflows of $408 million. The flows can be interpreted as an escape from the traditional banking sector towards alternative safe-havens.
The inflows mainly targeted the leading cryptocurrency, bitcoin, which accounted for 128 million dollars of the flows. Bitcoin-linked short positions were also popular with investors, with $31 million flowing into them. Fund flows to Ethereum have remained modest, with $5,2 million weekly outflows from investment products related to the DeFi platform.
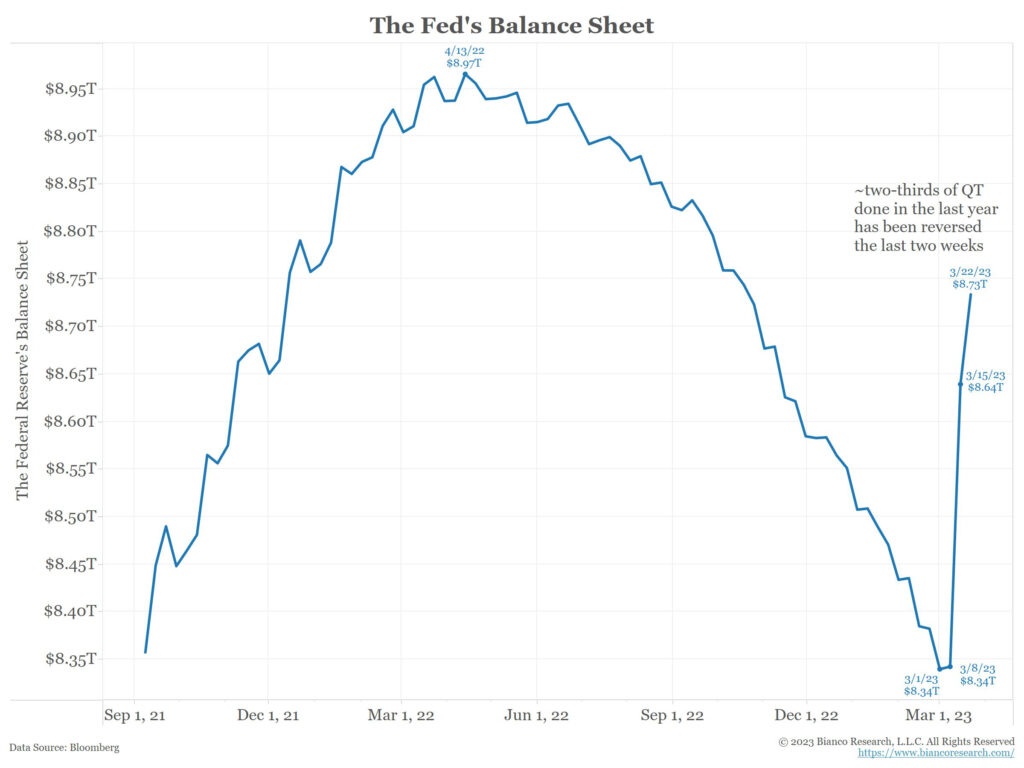
The central bank Fed’s “pivot,” long speculated by investors, seems to be finally coming to fruition. According to Bianco Research, the Fed’s balance sheet grew from 8,34 trillion to 8,73 trillion dollars in March. The increase also nullifies two-thirds of the tightening measures implemented in 2022 and 2023. Therefore, the banking crisis has forced the central bank to move from quantitative tightening (QT) to quantitative easing (QE).
Many analysts, such as Luke Gromen and Raoul Pal, have predicted a reversal of interest rate policy in 2023, as the economic structures cannot withstand a radically elevated interest rate. The change from quantitative tightening to easing will decisively change the dynamics of many markets, and high-beta assets are usually among the first to benefit. Investors are now trying to price the effect of the QE period on bitcoin, which rose a remarkable 65 percent in the first year.
Despite everything, western central banks are still in a challenging position. With inflation in the euro area shooting at an exceptional level, the need for interest rate hikes is probably critical. At the same time, high-interest rates and tightening clearly harm the ordinary wage earner and the entire banking sector. The new stimulus measures being implemented now may once again act as a catalyst for rising inflation.
Michael Saylor in Accumulation Mode Again
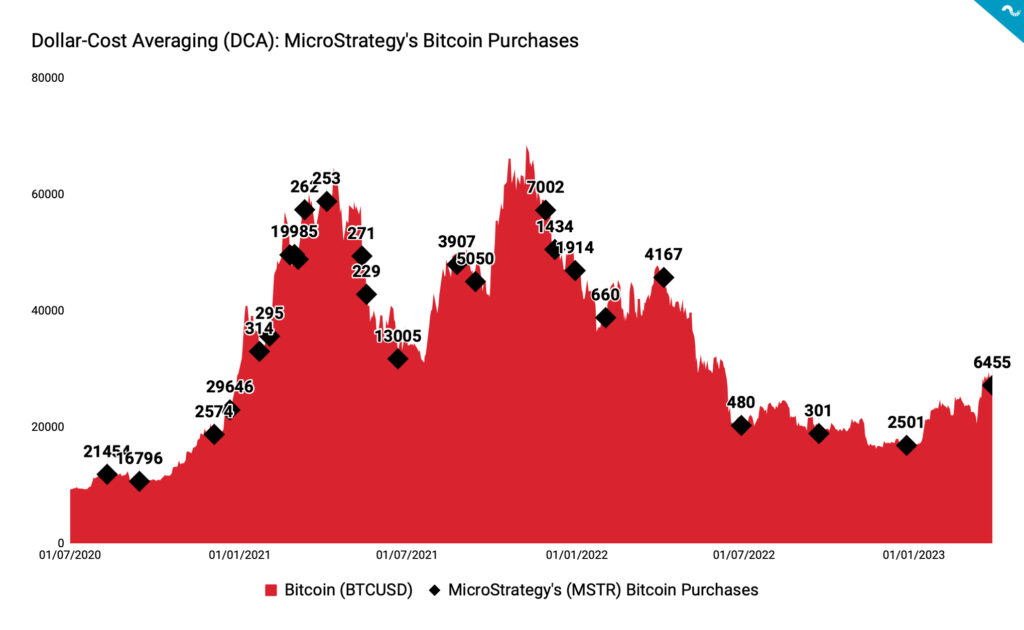
Michael Saylor announced this week that MicroStrategy (MSTR) acquired 6455 new bitcoin native units, bringing its total balance to 138 955 bitcoins. MicroStrategy’s bitcoin holdings are now worth about $4,14 billion and were acquired at an average price of $29 238. Historically, the share price of MicroStrategy (MSTR) was highly correlated with the price of bitcoin in the second half of 2020 (H2), but the correlation weakened in 2021. When the spot price of bitcoin rose to its second peak of the 2021 double-peak structure, MSTR no longer followed the same correlation. Now, in the spring of 2023, MSTR and BTC are again correlated as the company’s stock has climbed 71 percent, while bitcoin reached a 65 percent rise.
Michael Saylor and MicroStrategy, which he founded in 1989, have profiled themselves as pioneers in institutional bitcoin investing. The company’s turning point occurred in July 2020, when Saylor announced that it would replace the company’s dollar holdings with bitcoins and alternative assets. Saylor is also known for his bitcoin theses, which include defensive, opportunistic, and strategic arguments.
The attached chart, created by Coinmotion Research, gives an overall picture of MicroStrategy’s bitcoin acquisitions. As the chart shows, the company accumulated very actively in 2020 and 2021, but during 2022 the purchases remained modest. MicroStrategy has been seen as an indicator of institutional appetite, and the purchases in Q1 can be seen as a sign of a broader market recovery. Players like MicroStrategy are the first to increase their bitcoin exposure after an inflection point, and the MSTR stock can be seen as a leading indicator of the market.
The Stablecoin Binance USD in a Steep Decline
The United States is once again facing escalating regulatory pressure, primarily through the Securities and Exchange Commission (SEC). The growing regulatory pressure is not only directed at exchange operators but also social media influencers are now in the sights. This week, the US Commodity Futures Trading Commission (CFTC) sued the globally leading exchange Binance and its CEO Changpeng Zhao (CZ). Binance is mainly accused of enabling US customers to trade, even though its operations should be geofenced.
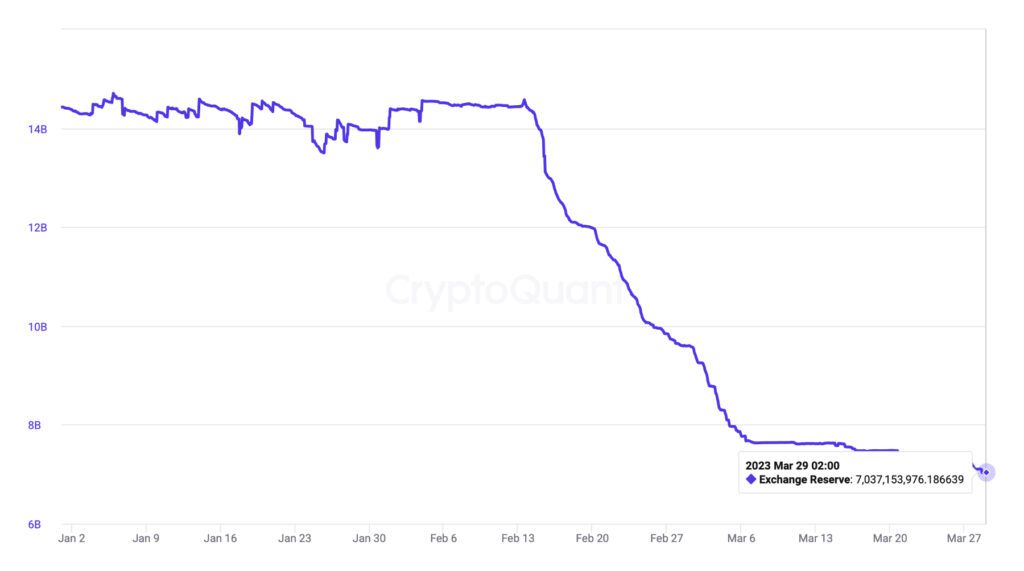
Paxos, previously sued by the SEC, and the CFTC’s charges have particularly hit Binance’s BUSD stablecoin (Binance USD), whose exchange reserves have halved during the first quarter of 2023. Back in February, the exchanges’ BUSD reserves were more than 14 billion units; towards the end of March, the amount dropped to seven billion.
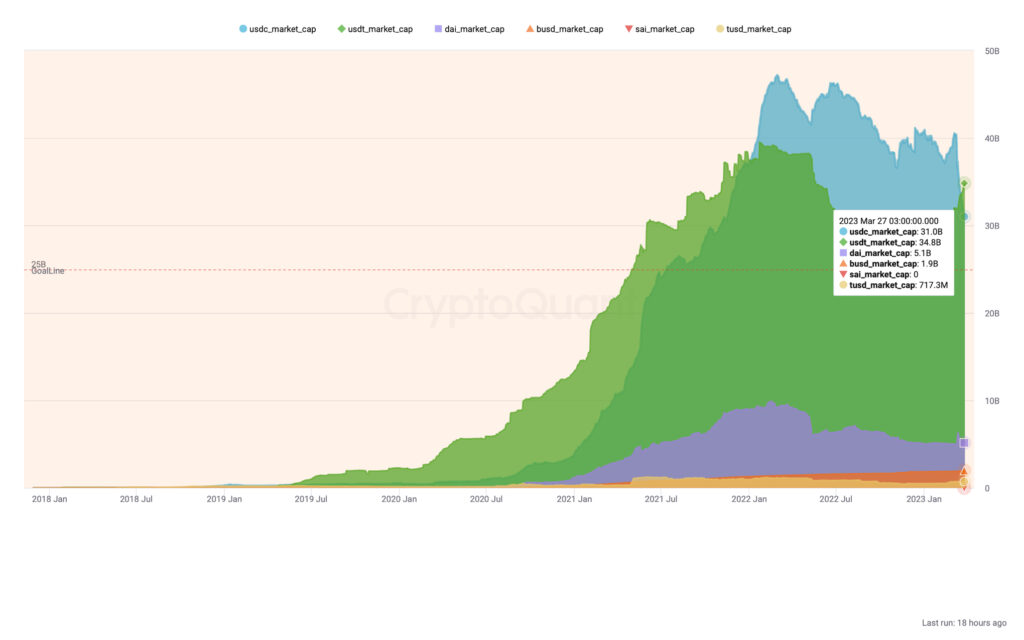
In the broader picture, CryptoQuant’s data shows how the stablecoin Tether (USDT), in particular, has strengthened its market share. The market value of Bitfinex-backed stablecoin was 34,8 billion dollars at the end of March, and as Tether grows, the market value of its main competitor USD Coin (USDC), falls in inverse correlation. The USDC, launched by the fintech company Circle, currently has a market cap of $31 billion, $3,8 billion below Tether. Compared to these two dominant stablecoins, Binance USD’s current market cap of $1,9 billion is almost negligible.
What Are We Following Right Now?
Artificial intelligence ChatGPT was tasked with continuing the series of numbers based on the January price development of bitcoin. Based on the sequence, ChatGPT estimates the price of bitcoin to be $142 514 in January 2024.
Alfonso Peccatiello and Andreas Steno Larsen discuss the possible further contagion of the banking crisis. In addition, they evaluate central banks’ liquidity measures and their consequences for the broader market.

Glassnode’s comprehensive weekly on-chain report.

Stay in the loop of the latest crypto events
- Why is Bitcoin rising in 2023?
- What has happened in the crypto market in Q1 — and what is to come?
- Technical Analysis: Bitcoin Retains its Momentum Amid the Chaos
- Is Bitcoin Decoupling from Other Asset Classes?
- Aave launches native stablecoin GHO
- New Bitcoin NFTs spark discussion — What are Bitcoin Ordinals?
- Bitcoin marketplace LocalBitcoins is closing — here’s how to transfer funds to Coinmotion
- EUROe stablecoin — First EU-regulated stablecoin launched in Finland | Interview with Juha Viitala
- How did Norway become the largest Bitcoin mining hub in Europe?

The views, thoughts, and opinions expressed in the text belong to the author and not necessarily to the author’s employer, organization, committee, or other group or individual.