

The technical analysis of week 10 looks at the dramatic market reversal during the last seven days and bitcoin’s technical indicators. In addition, we analyze the realized price and its UTXO waves. We also examine why the spot price can be interpreted as continuing to rise and whether bitcoin is able to break away from other asset classes.
Weekend’s Dramatic Price Action
The crypto market has provided extraordinary excitement for investors, with bitcoin’s market sentiment drifting from one extreme to the other within a week. Bitcoin’s price trend looked very negative heading into the weekend, with the spot price falling from $22 000 to the $19K level. However, as the US banking crisis gathers momentum, bitcoin jumped up on Sunday and surged towards the highs of the year at the beginning of the week. There are several factors behind the extraordinary turning point, the most obvious of which is the investors’ view of bitcoin as a safe haven during the escalating banking crisis. On the other hand, the leading US exchange Coinbase had significant risk exposure to Silicon Valley Bank, which the central bank Fed eventually bailed out.
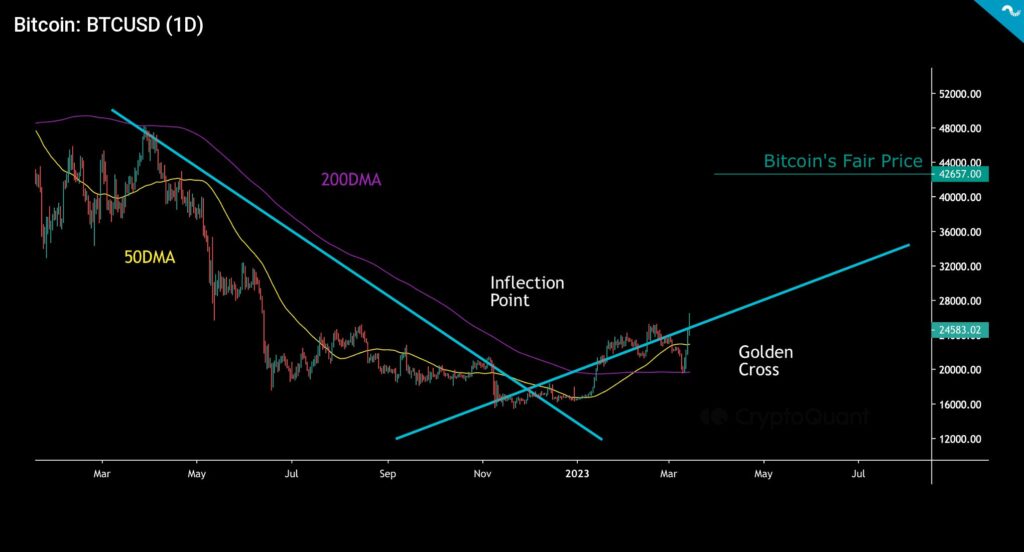
On a technical level, a clear paradigm shift can be seen in the bitcoin market when the falling and rising trend lines (turquoise) met at the turn of the year. The intersection of the trend lines indicates the end of the distribution cycle and the beginning of a new accumulation cycle preceding the halving event. At the same time, bitcoin’s 50 (yellow) and 200 (purple) day moving averages formed a golden cross, which is considered a promising technical signal. At the same time, the spot price took a rebound from the 200-day moving average, reversing its direction radically over the weekend. In the big picture, bitcoin can be seen reaching its “fair price” (green), which is located at $42 657.
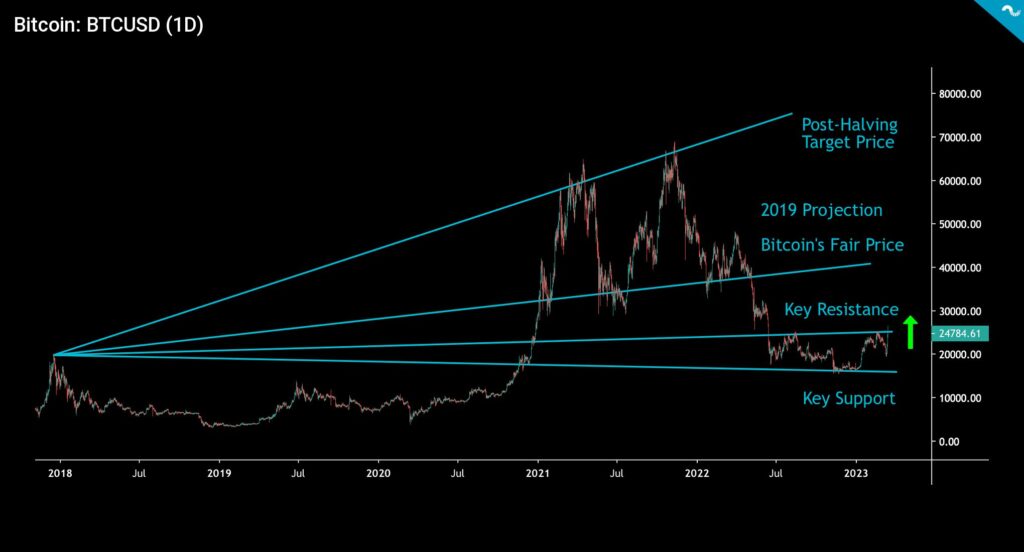
Bitcoin’s spot price appears to closely follow price projections derived from the 2017-2018 cycle peak. The lowest turquoise trend line depicts the most important support level, which bitcoin has closely followed. The level above that acted as a long-time resistance for the price, but the spot managed to break through it at the beginning of the week (green). The higher levels are, e.g., the projected price derived from 2019 and the speculative price levels after the halving event.
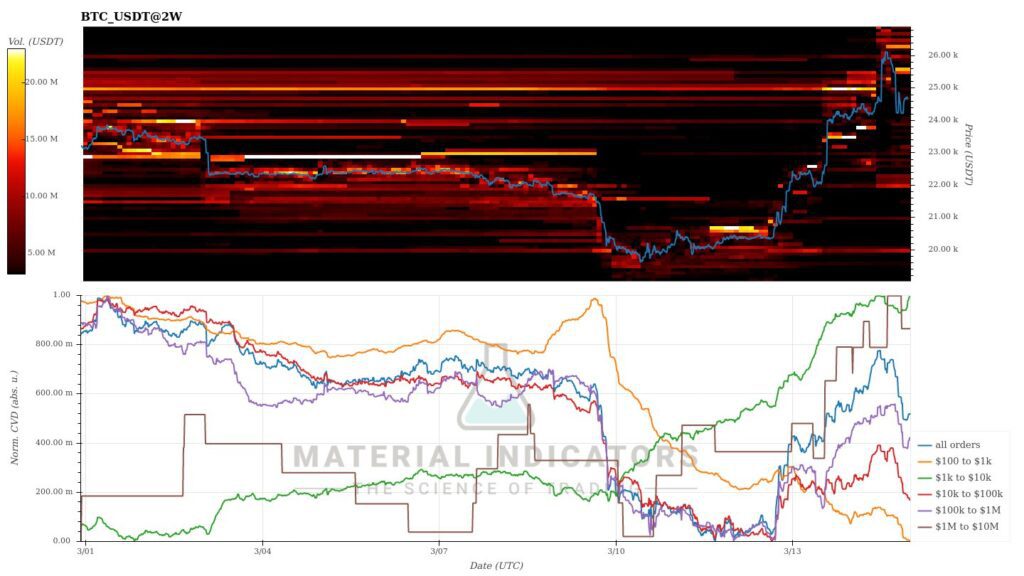
The Material Indicators heatmap shows how bitcoin broke through numerous resistance levels over the weekend. The sudden rise of the spot price surprised the market and, at the same time, caused a short squeeze situation for traders who believed in a market decline. The $25-26K area still acts as a significant resistance, which bitcoin likely has to try to cross several times.
The leading cryptocurrency, Bitcoin, has strengthened by more than 12 percent since last week, and Ethereum by 9,6%, strongly correlating with the former. Somewhat surprisingly, the field of other cryptocurrencies is in a clear divergence, and many higher beta tokens have not yet caught up with bitcoin. The leading stock index S&P 500, has fallen -1,7 percent in a week, and gold, which acts as a hedge for the banking crisis, has strengthened by 5,2%.
7-Day Price Performance
As the banking crisis escalated, the exchanges saw a huge inflow of native bitcoin units, which was also contributed by the uncertainty associated with the stablecoin USD Coin (USDC). The USDC temporarily lost its peg to the US dollar but has since managed to stabilize its position.
Bitcoin’s Spot Price Critically Close to the Realized Price
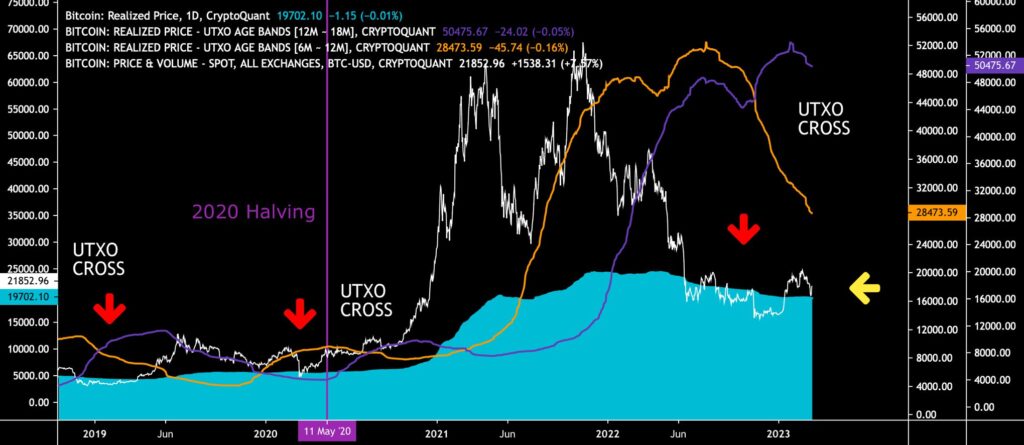
Perhaps the most important indicator of the bitcoin market, the realized price, served investors with excitement at the end of the week. The spot price (white) was very close to the wave of the realized price (turquoise) but nevertheless pivoted up from its surface. The realized price has been seen as a watershed in the market as it represents the average price of all bitcoin purchases. At the same time, the spot price on top of the realized price shows that bitcoin investors are making a profit on their investments.
The realized price UTXO waves have shown the market bottom of bitcoin for many years. In 2019, the depression of the 6M-12M wave (orange) below the 12M-18M wave (purple) (utxo cross) indicated a market base. The same structure was realized again in 2020. Additionally, the phenomenon was repeated at the end of 2022, when 6M-12M sank clearly below 12M-18M, while their divergence increased. If the rise in the spot price continues, the orange UTXO wave will climb above the purple wave again.
Bitcoin Seemingly Decoupling from Other Asset Classes
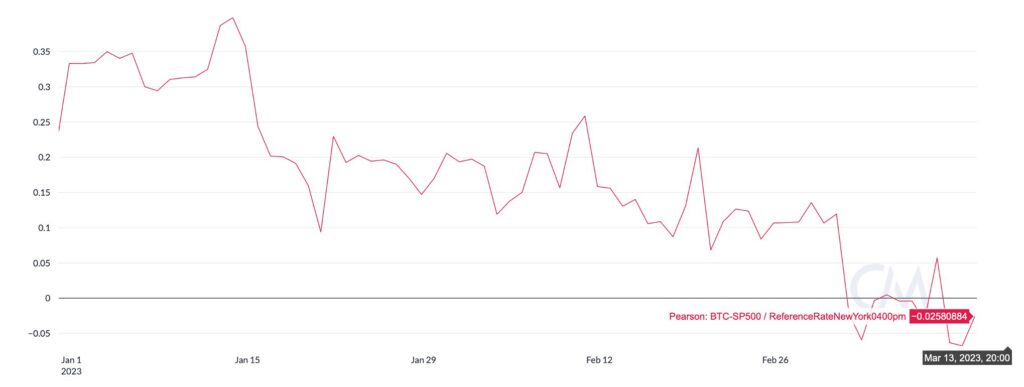
The decoupling of bitcoin and the stock market has been talked about for a long time, but now the 30-day Pearson correlation shows that the relationship is clearly weakening. Looking at the correlation development since the beginning of the year, the trends of bitcoin and the S&P 500 index converged in January, with the correlation rising to the highest level of almost 0,4. Since then, the correlation has gradually decreased towards zero at the end of February, falling to the current value of -0,03. The correlation between bitcoin and the stock market has therefore been close to zero within the past weeks and is currently slightly negative.
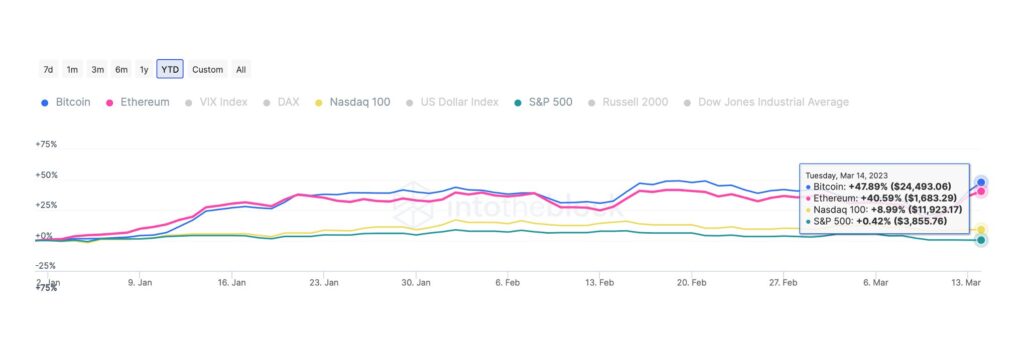
The data collected by IntoTheBlock offers a broader perspective on the development trends of different asset classes. Bitcoin has risen by a commendable 48 percent since the beginning of the year, while the DeFi platform Ethereum has strengthened by 41%. The Nasdaq 100, which mirrors the technology sector, has climbed 9 percent since the beginning of the year, and the S&P 500 index a modest 0,42%. Compared to the leading stock indices, the price development of cryptocurrencies has been in a class of its own.
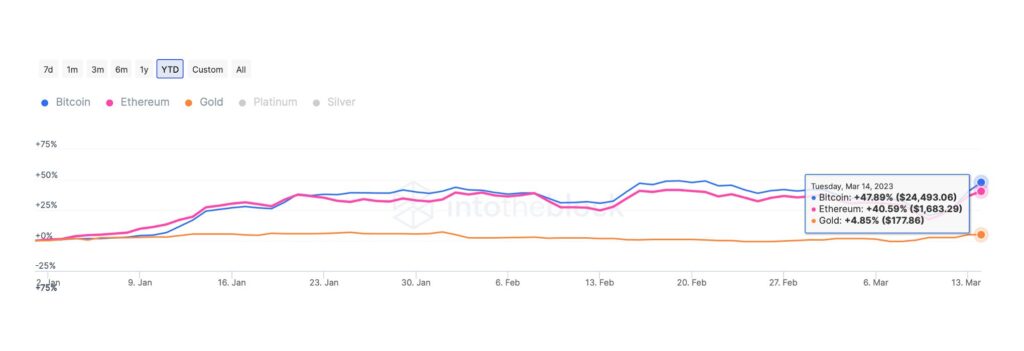
At the same time, the “digital gold” bitcoin has surpassed the performance of gold, which is close to it in its scarcity characteristics, by about tenfold. With bitcoin rising almost 50 percent since the beginning of the year, gold has strengthened by 4,9% over the same time horizon. However, it is worth remembering that gold still offers protection against inflation according to its investment narrative, so there is no reason to talk about the actual value promise being broken.
Spiking Fees to Reward Ratio Indicates More Upside Ahead
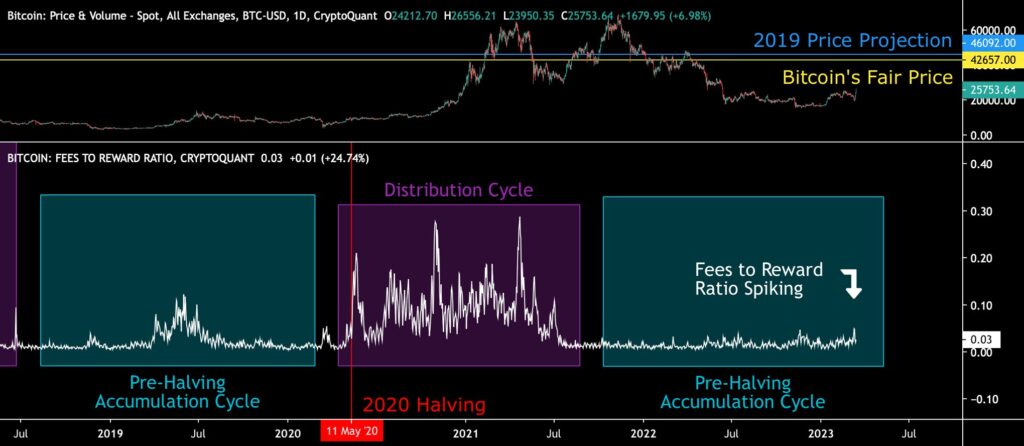
The leading cryptocurrency, bitcoin, has gone through an exceptional early year, reinforcing the spot price by almost 60 percent year to date (YTD). In the recent price spike, bitcoin reached a new 2023 high of 26 562 US dollars. From a wider perspective, bitcoin’s market behavior can be segmented into distribution (violet) and pre-halving accumulation (turquoise) epochs, which form a sequence of cycles. Accumulation cycles have been favored by smart money (institutions), while distribution cycles have been characterized by escalating retail demand.
The shift from accumulation to distribution cycle can be forecasted by fees to reward on-chain data (white), which has a tendency to spike before each distribution cycle. The phenomenon recently occurred in 2019 and 2020.
In the pre-halving accumulation cycle of 2019, the fees-to-reward ratio spiked before the summer relief rally, rising to 0,12. In 2020, the fees to reward ratio spiked again, first reaching 0,21 in May and later 0,29 in November. The very recent on-chain data show fees to reward ratio spiking again, reaching 0,05 as the highest peak of 2023. The structure likely indicates further upside ahead and spot advancing towards the current “fair price” of $42 657. The fair price heavily correlates with my earlier 2019 model, which forecasts bitcoin reaching $46 092 this year.
Coinbase’s Premium Index Reflects US Demand
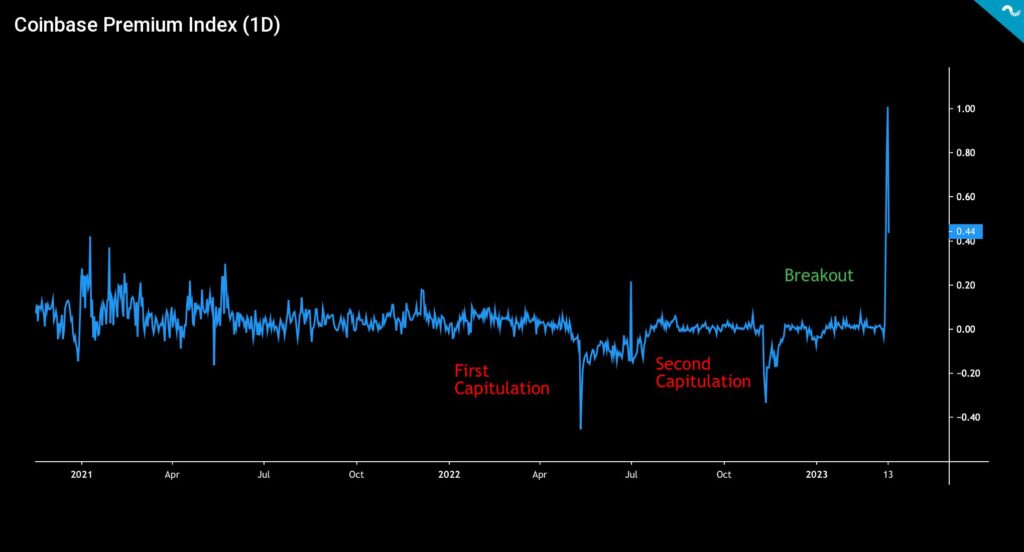
Coinbase was one of the first publicly listed crypto exchanges in the world (ticker: COIN), and the company is also one of the most transparent actors in the industry. These features make Coinbase particularly attractive to American institutions and HNWI clients. The embedded chart uses the Coinbase Premium Index, which measures the percentage difference between the bitcoin price on Coinbase (USD pair) and Binance (USDT pair).
Coinbase’s premium index shows how the market faced two capitulation points (red) last year in the selling pressure of both the end of spring and the end of the year. However, the premium index has reached an exceptional surge, reaching a value of 1 during the current banking crisis. The premium index can therefore be interpreted as US investors, in particular, now seeking protection for themselves with a growing bitcoin exposure. The growing mistrust of banks thus seems to correlate with the growing popularity of bitcoin.
What Are We Following Right Now?
The Finnish fintech house Equilibrium has published a comprehensive annual review, which reveals that the company doubled its revenue and number of employees last year. The busy year included launches of their Swiss branch and the Membrane Finance company known for its EUROe stablecoin.
Will the banking crisis expand further? Credit Suisse is rumored to be in trouble.
The US regulatory pressure on crypto is increasing, and as the latest measure, the state of New York sued the well-known KuCoin exchange. The state accuses KuCoin of operating in the industry without a proper license.
How does the banking crisis affect the operation of the central bank Fed? Will the Fed continue its rate hikes? Danielle DiMartino shares her views on the situation.

Stay in the loop of the latest crypto events
- Amazon rumored to be launching its own NFT marketplace
- Silvergate FUD Weighs on the Market
- Aave launches native stablecoin GHO
- Technical Analysis: Bitcoin Trying to Break the $25K Key Resistance Level
- New Bitcoin NFTs spark discussion — What are Bitcoin Ordinals?
- Bitcoin marketplace LocalBitcoins is closing — here’s how to transfer funds to Coinmotion
- EUROe stablecoin — First EU-regulated stablecoin launched in Finland | Interview with Juha Viitala
- How did Norway become the largest Bitcoin mining hub in Europe?
- Ripple v. SEC update

The views, thoughts, and opinions expressed in the text belong to the author and not necessarily to the author’s employer, organization, committee, or other group or individual.