
The technical analysis of week 11 evaluates the exceptional market environment with the help of technical indicators. In addition, we map the data of the derivatives market and the realized price of bitcoin. We also examine the likely outcome of Wednesday’s FOMC meeting and the break-evens of different investor segments.
The Pre-Halving Accumulation Cycle Supports Bitcoin
The exceptional price development of the crypto market has continued this week, correlating with the growing risk coefficient of the banking sector. The massive turbulence in the market has led bitcoin, the largest cryptocurrency by market value, to rise almost 20 percent in seven days. Bitcoin is clearly the market’s leading indicator, and the price development of well-known cryptocurrencies is clearly falling behind it. Tone Vays, known as an analyst and options trader, shows clear confidence in the bitcoin market by increasing his allocation from 40% to 100%.
At the end of 2022, bitcoin passed its technical inflection point (turquoise), which represents the new epoch for the spot price. At the same time, bitcoin is moving from a bear market distribution cycle (gray) towards a pre-halving accumulation cycle (blue). There are less than 400 days until the halving in 2024, and investors are trying to price the event’s premium already. The exchange stablecoin ratio (yellow, ESR) started to rise after a long decline, indicating that a market base had been found. Since the beginning of the year, ESR has been forming a divergence from bitcoin’s spot price, and at the same time, ESR has acted as a leading indicator for the spot. It is likely that the spot price will follow the exchange stablecoin ratio up during this year.
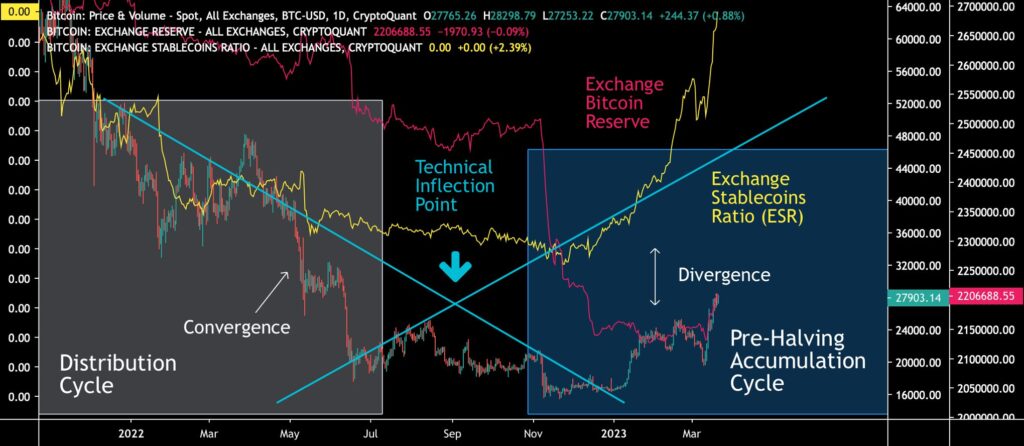
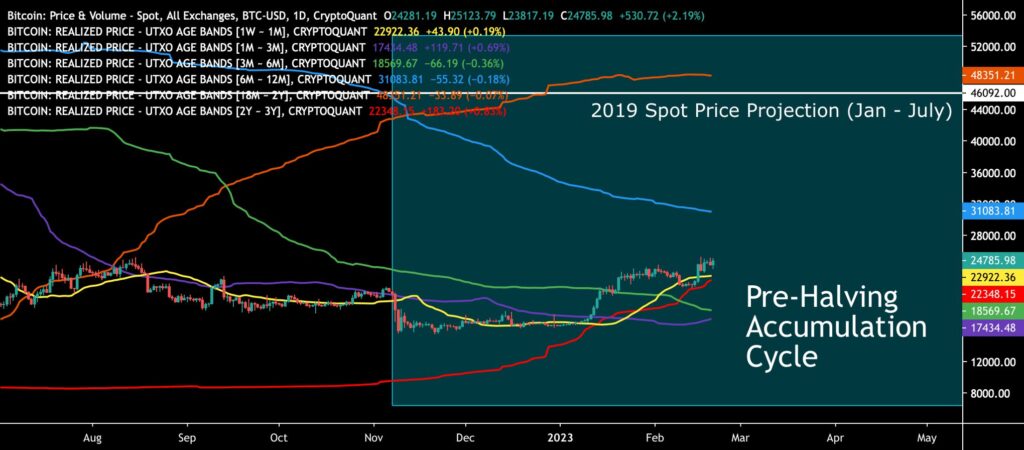
Bitcoin just passed Deutsche Bank’s $28 000 target price and is now heading towards its “fair price” of $42 105. Our 2019-based model presented earlier in the spring predicts bitcoin rising to $46 092 by July. Bitcoin now seems to be clearly benefiting from the uncertainty of the traditional financial market, and its investment narrative has remained intact amid the chaos.
Read more: Deutsche Bank Sees Bitcoin Recovering to $28K Level
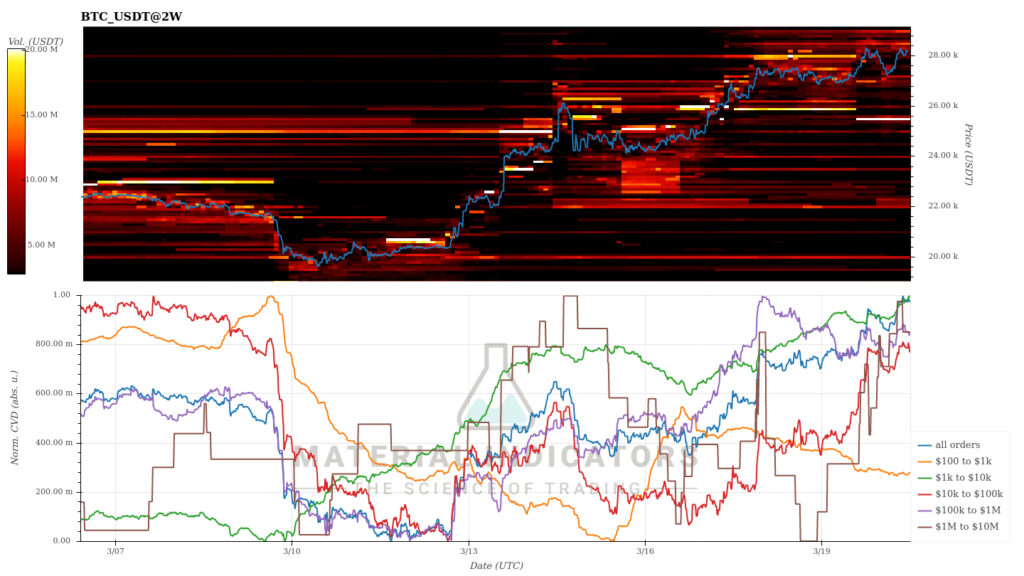
The Material Indicators’ heat map shows that bitcoin has broken several resistance levels in the past week. Additionally, according to the heat map, the resistance levels above bitcoin are relatively weak, allowing the spot price to move up. At the same time, traders’ eyes are focused on Wednesday’s FOMC meeting.
Although the leading cryptocurrency, bitcoin, strengthened by almost 20 percent in a week, the correlation to other cryptocurrencies has weakened. The pattern is a déjà-vu from previous years when bitcoin’s parabolic price increases clearly ate up space from altcoins. Only bitcoin turning sideways usually gives the alts more momentum. The divergence of the market is particularly visible in the correlation between bitcoin and the Aave token, which has dropped to 0,72 in seven days. The correlation between bitcoin and XRP has weakened to a level of 0,3 in a week, while on a yearly basis, it is still at 0,67. XRP’s price is boosted by positive forecasts regarding the legal battle against the US Securities and Exchange Commission SEC. The stock index S&P 500 and gold have both risen by about two percent in a week.
7-Day Price Performance
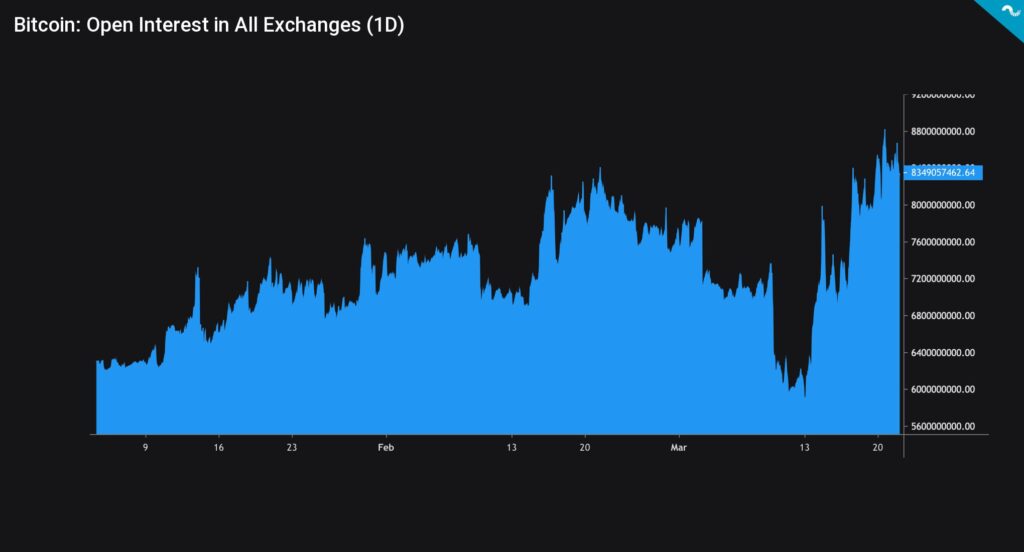
Bitcoin’s Open Interest Hits a Yearly High
The amount of open interest (OI) in the bitcoin derivatives market has reached a new 2023 record of 8,3 billion dollars. As recently as March 13th, OI hovered at $5,9 billion, thus rising 41 percent in a week. What then increases the number of open derivative contracts? The simplest explanation is the growing number of long positions (longs) in the derivatives market and investors believing that bitcoin will continue its price rise.
Many traders are also expecting a favorable result at this week’s FOMC meeting, which may give additional momentum to the market. However, the escalating number of long positions increases their risk exposure because a collapse of the spot market could liquidate a huge number of long positions at once. Although the market looks very attractive, we recommend special caution in the derivatives market.
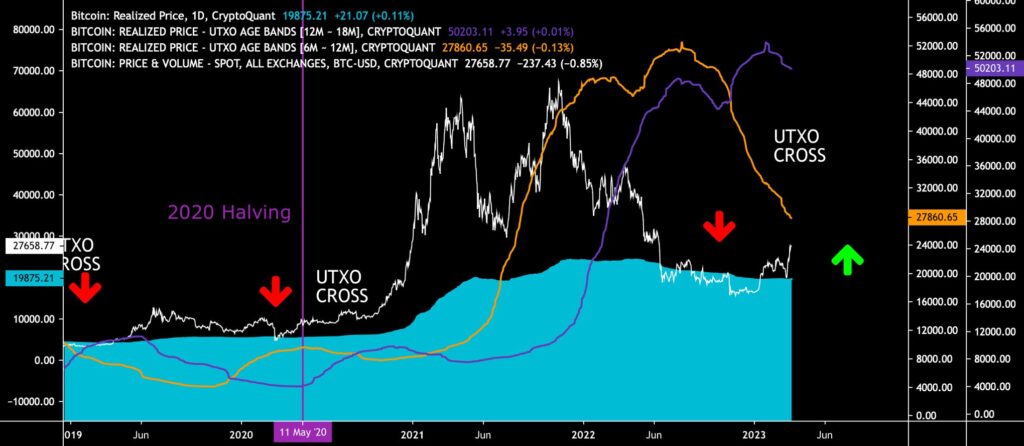
The dramatic reversals of the market are reflected in bitcoin’s relation to its realized price (turquoise), from which the spot price took a strong rebound on March 10th. Now the spot has already reached the level of May 2022, turning clearly away from the surface of the realized price. The realized price has been seen as a watershed in the market as it represents the average price of all bitcoin purchases. At the same time, the spot exceeding the realized price shows that bitcoin investors are making a profit on their investments.
The realized price UTXO waves have shown the market bottom of bitcoin for many years. In 2019, the depression of the 6M-12M wave (orange) below the 12M-18M wave (purple) (utxo cross) indicated a market base. The same structure was realized again in 2020. Additionally, the phenomenon was repeated at the end of 2022, when 6M-12M sank clearly below 12M-18M, while their divergence increased. The meeting of the UTXO waves at the end of 2022 can therefore be seen as confirming the market bottom.
Focus on Wednesday’s FOMC
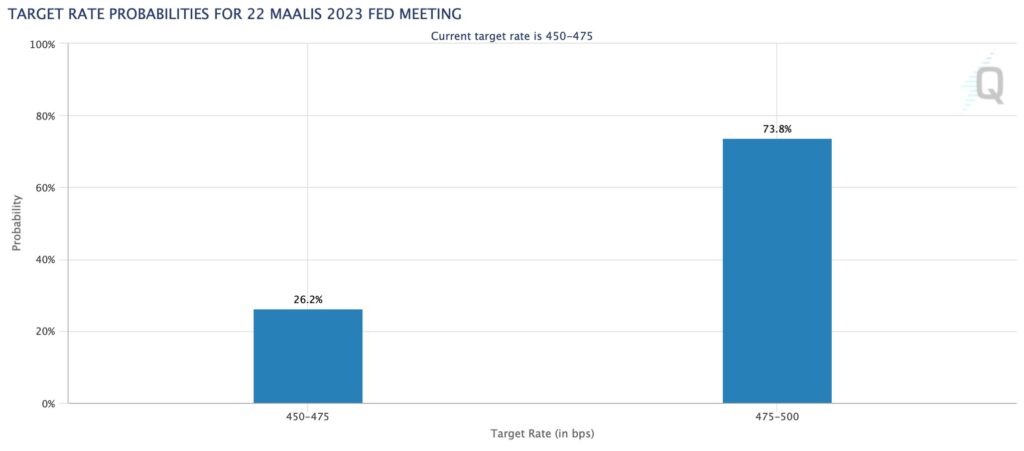
The market is anxiously waiting for the Fed’s FOMC meeting on Wednesday, where the broad guidelines of the world’s largest central bank’s interest rate policy will be drawn again. According to CME’s data, 26,2 percent of investors believe that the current interest rate policy will remain in place, while 73,8 percent believe in the possibility of a 25 basis point rate hike. Both options seem light compared to the previous one-time hikes of 75 basis points.
Western central banks have been very hawkish in their monetary policy since last year when inflation data started to reflect worrying readings. The goal of central banks has been to counter rising inflation with quantitative tightening (QT) and interest rate hikes. However, many analysts, such as Luke Gromen and Raoul Pal, have predicted that the interest rate policy will be reversed in 2023 because the economic structures cannot withstand an elevated interest rate level.
The switch from quantitative easing (QE) to tightening (QT) has decisively changed the dynamics of many markets, and high-beta asset classes, including cryptocurrencies, have also taken a hit. Despite last year’s bear cycle, bitcoin has managed to rise a commendable 70 percent at the beginning of the year.
Despite everything, March saw the real paradigm shift of the season when the Fed’s balance sheet turned to a sharp growth. The crises of Silicon Valley Bank and Credit Suisse have forced the central bank to buy again, despite the risk of inflation. The Fed’s balance sheet grew by $297 billion last week, representing the fourth-largest weekly increase ever. Following in the footsteps of the Fed, the ECB also has to stabilize the euro area market by acting as an active buyer.
Western central banks are in many ways between the tree and the bark. With inflation in the euro area shooting at an exceptional level, the need for interest rate hikes is probably critical. At the same time, high-interest rates and tightening clearly harm both the ordinary wage earner and the entire banking sector. The new stimulus measures being implemented now may once again act as a catalyst for rising inflation.
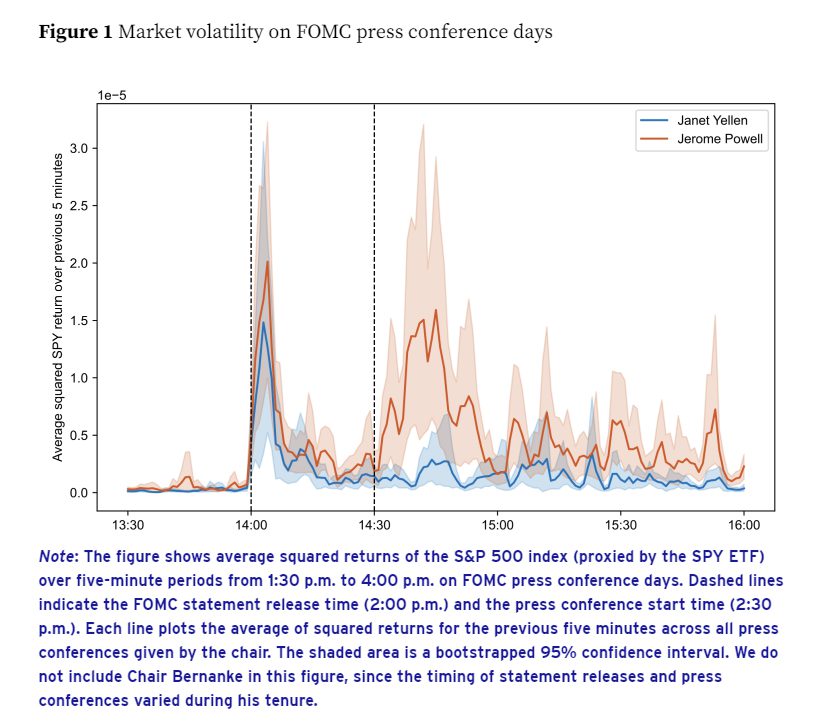
According to research by the Center for Economic Policy Research (Namrata Narain, Kunal Sangani), the impact of FOMC meetings on market volatility has grown significantly from Janet Yellen’s era to the current Jerome Powell. The study shows how market volatility of the FOMC day is up to three times as large in the current Powell term as during the previous chair’s term.
Short-Term Investors Clearly in Profit
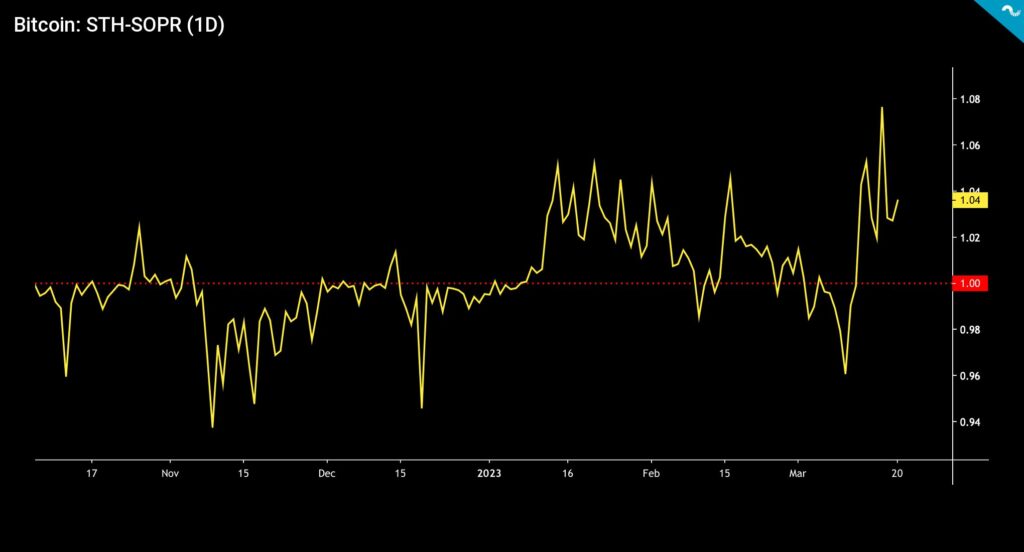
The SOPR indicator was originally developed by Renato Shirakashi, and it’s calculated by dividing the realized value of bitcoin (USD) by the value of the original bitcoin transaction. Or, in simplified terms, the selling price is divided by the purchase price. The SOPR indicator can be interpreted with the following logic:
SOPR > 1 = Seller in profit
SOPR < 1 = Seller at a loss
The SOPR data reflects how during last year’s deep bear cycle, the STH-SOPR value of short-term investors dropped to a low of 0,91. After the turn of the year, however, short-term investors have clearly risen above the break-even point (red, 1), with the STH-SOPR reading peaking at 1,08. Short-term investors have clearly benefited from the 70 percent rise in bitcoin’s spot price in early 2023.
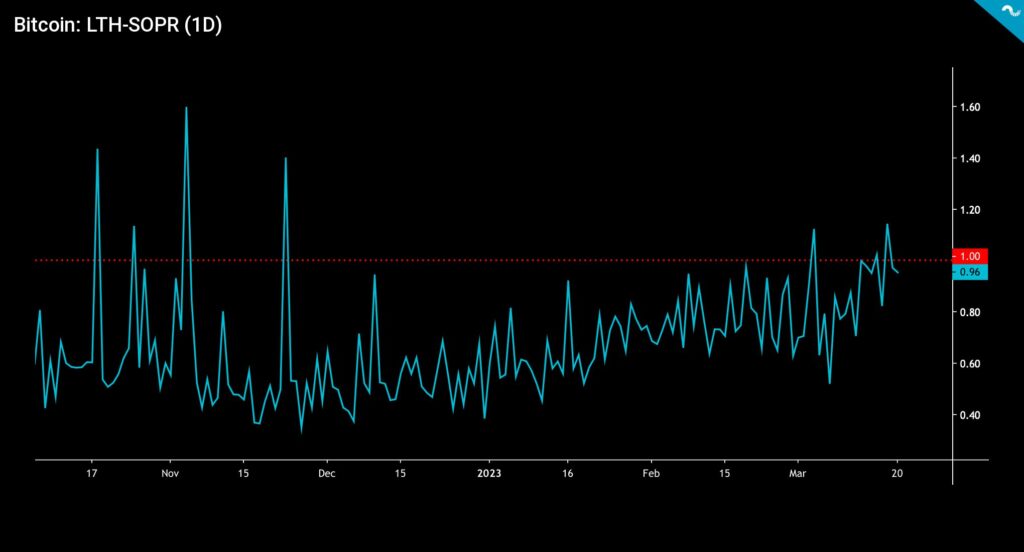
Long-term investors (LTH-SOPR) have again countered short-term investors because the first months of 2023 are clearly below the break-even point (red, 1). Only during March has LTH-SOPR been able to rise slightly above the break-even. Many of the longer-term investors have made their allocation when the spot price was quoted higher. If our 2019-based model materializes, their investments will become profitable in the coming months.
What Are We Following Right Now?
Alfonso Peccatiello and Andreas Steno Larsen discuss the collapse of SVB bank and its fallout. In addition, experts ponder whether quantitative easing (QE) is making a permanent comeback.

Bard College assistant professor Daniel Neilson estimates that the banking crisis was caused by the shrinking of the Fed’s balance sheet.

Cathie Wood of ARK Invest, a company focused on disruptive technology, comments on the banking crisis, bitcoin, and her latest investment strategy.

Stay in the loop of the latest crypto events
- What has happened in the crypto market in Q1 — and what is to come?
- Is Bitcoin Decoupling from Other Asset Classes?
- Aave launches native stablecoin GHO
- Technical Analysis: Bitcoin Trying to Break the $25K Key Resistance Level
- New Bitcoin NFTs spark discussion — What are Bitcoin Ordinals?
- Bitcoin marketplace LocalBitcoins is closing — here’s how to transfer funds to Coinmotion
- EUROe stablecoin — First EU-regulated stablecoin launched in Finland | Interview with Juha Viitala
- How did Norway become the largest Bitcoin mining hub in Europe?
- Ripple v. SEC update

The views, thoughts, and opinions expressed in the text belong to the author and not necessarily to the author’s employer, organization, committee, or other group or individual.