

The technical analysis of week 17 looks at the latest technical and fundamental indicators. We study, e.g., bitcoin’s technical channel pattern and heat map. In addition, we map bitcoin’s realized price, correlations, and supply delta.
The Technical Structure Shows Signs of Weakness
The price action of the crypto market has been slightly negative since last week, with bitcoin weakening by about one percent in seven days. The crypto market is currently sailing between the difficulties of the banking sector and the changes in central bank policy. This week was especially defined by the Fed’s FOMC meeting, which ended with an expected 25 basis point rate hike.
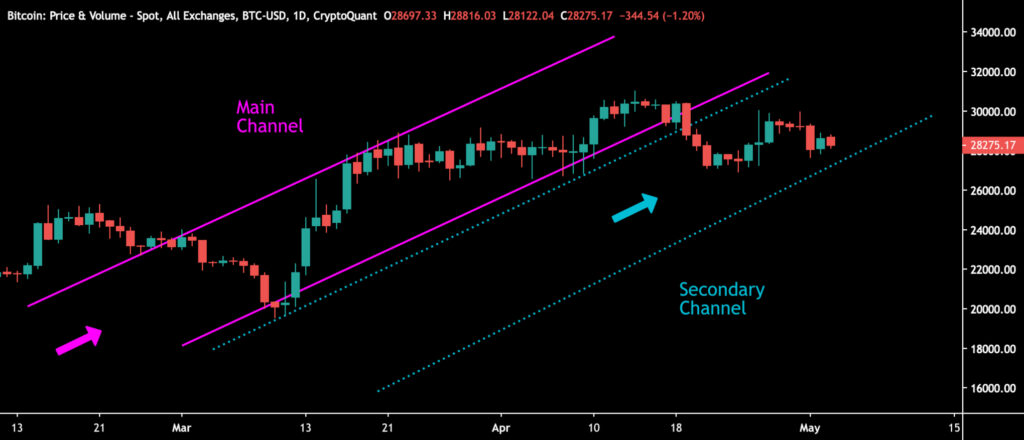
As bitcoin’s technical setup moves sideways, it has fallen from its March bullish main channel (pink) to a secondary channel (turquoise). Bitcoin remained within its main channel even in the midst of the radical correction of March, but staying within the channel would have required stronger price increases.
Sources: Timo Oinonen, CryptoQuant
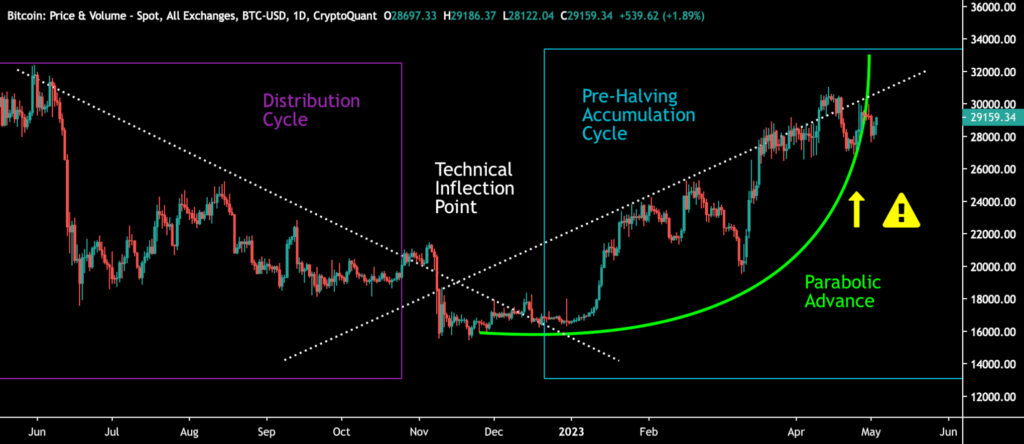
In addition to breaking the main channel, bitcoin broke its parabolic advance (green) at the turn of April-May. The breaking of the parabola means at least a short-term end to the early spring’s almost 100 percent bull cycle.
Sources: Timo Oinonen, CryptoQuant
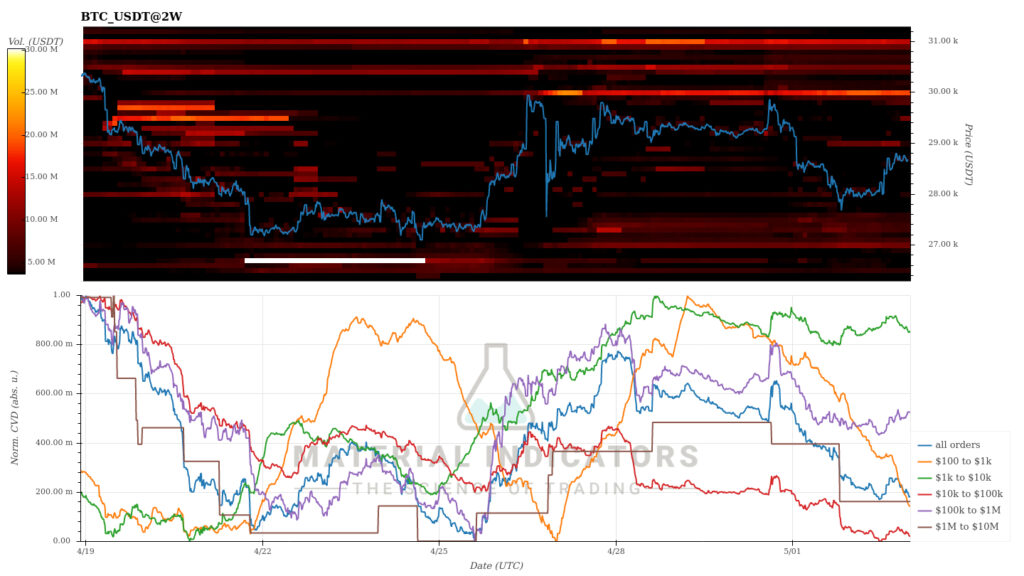
The Material Indicators heat map says that bitcoin’s resistance level is located at $30 000, which the spot price tried to break several times at the beginning of April. If the selling pressure increases, a weak support level for bitcoin can be found at the $27 000 level, allowing for wider price movements down. The cumulative volume delta (CVD) indicates that the market’s liquidity is in a short-term downward trend.
Source: Material Indicators
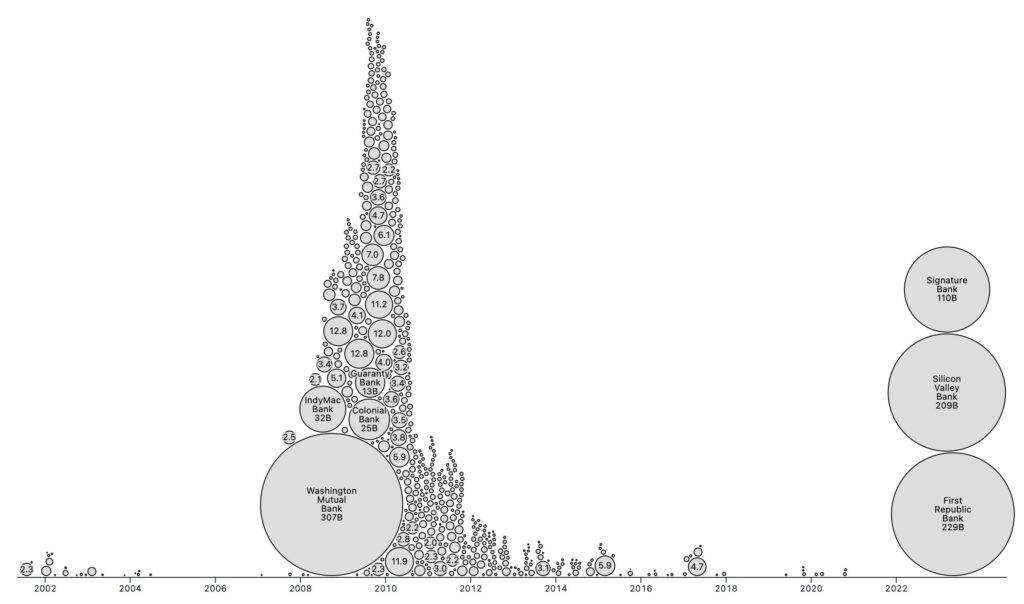
Despite the deteriorating technical setting, bitcoin’s wild card may be the growing cluster of problems in the banking sector. The problems of Signature Bank, Silicon Valley Bank, and First Republic Bank at the beginning of the year already approach the Subprime crisis of 2008 in size.
The success of bitcoin and gold, which share each other’s scarcity features, in the middle of the banking crisis means that investors view both assets as safe havens. In the midst of a potentially escalating banking crisis, bitcoin and (physical) gold offer their owners complete control over their assets without intermediaries or counterparty risk.
Source: Mike Bostock
The week has been moderately negative for cryptocurrencies, with smaller tokens correlating with bitcoin. Even the field of higher beta tokens has not seen real volatility. The leading stock market index S&P 500, is down -1,7 percent, but gold has risen around 2 percent alongside the risks in the banking sector.
7-Day Price Performance
Realized Price on the Edge of 20 000 USD
As a result of the recent positive price cycle, bitcoin has formed a clear divergence to the turquoise wave of the realized price, which at the same time is approaching the $20 000 borderline. The realized price has been seen as a watershed as it represents the average price of all bitcoin purchases. At the same time, the spot that exceeded the realized price shows that bitcoin investors are making a profit on their investments.
Right now, the bitcoin spot price (white) and the realized price’s 6M-12M wave (yellow) form a 2020-like setup where the spot rises above the wave. The same phenomenon also happened during the 2019 summer correction. Historically, this setup has meant a bullish price cycle.
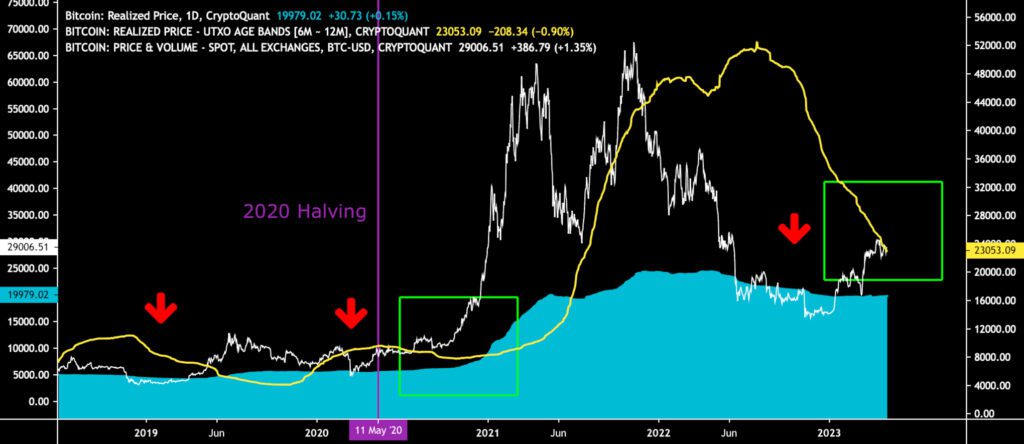
Sources: Timo Oinonen, CryptoQuant
Bitcoin has Decoupled from Technology Stock Correlation
The Fed’s 2022 contraction of the dollar supply (QT) clearly hit bitcoin and high-beta tech stocks. Indeed, these two assets were very closely correlated for a long time. However, the correlation reached its turning point at the beginning of 2023, when the performance of technology stocks was relatively weak as bitcoin rose to a parabolic price trend.
The embedded graph shows how the correlation between bitcoin and the Nasdaq index was still 80 percent at the end of 2022, while by May, the dependence ratio had dropped close to zero. Bitcoin has, therefore, clearly decoupled from the development direction of the technology sector.
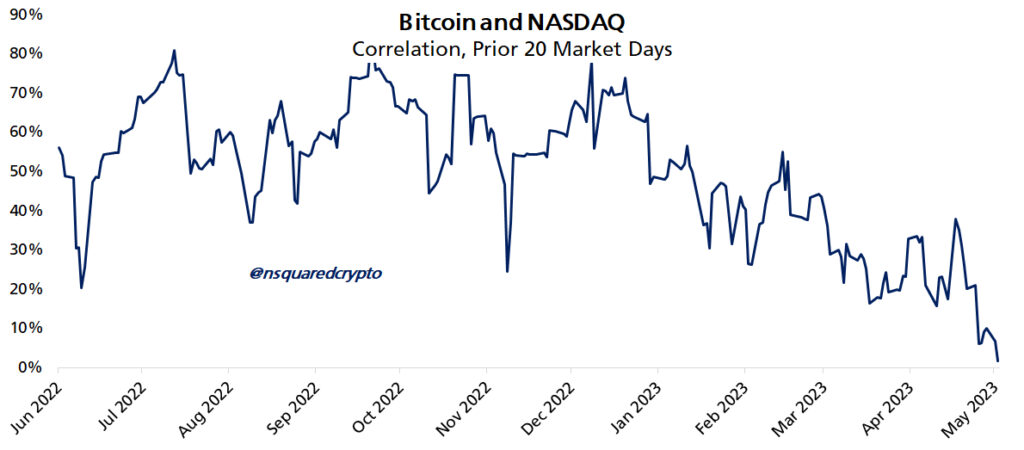
Source: nsquaredcrypto
In stark contrast to the Nasdaq correlation, bitcoin has clearly approached gold’s price performance, with the correlation rising to over 50 percent in May. This is a clear paradigm shift because back in November, the correlation between these two asset classes was practically negligible.
The stock market could possibly suffer from the May effect, which is based on the differences in the stock market’s seasonal returns. In the summer, the volatility of the stock market has traditionally been lower. At the same time, bitcoin’s breakaway from the correlation of the technology sector may mean that the leading cryptocurrency is more resilient to the May phenomenon.
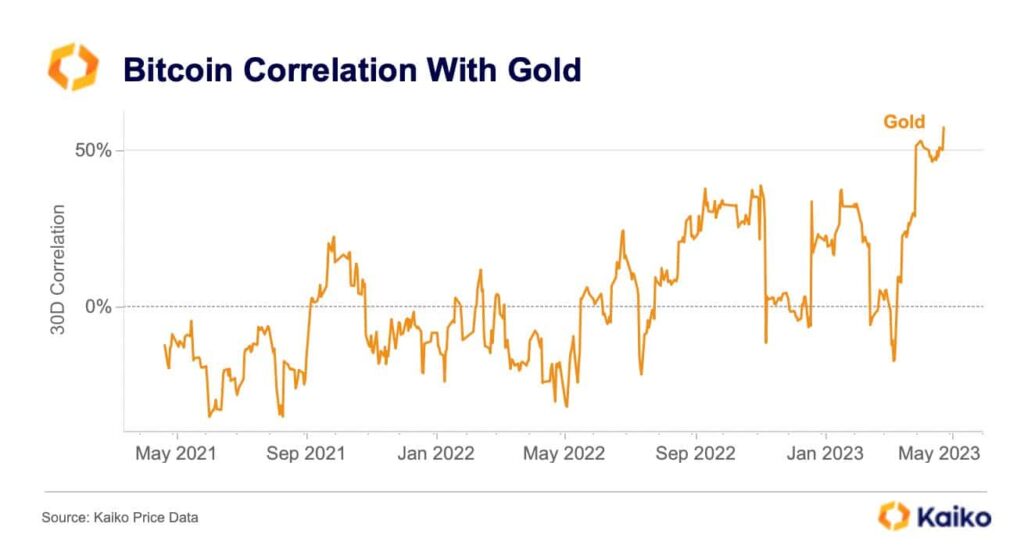
Source: Kaiko
Supply Delta Indicates a Market Bottom
Despite the weakness of the technical indicators, the bitcoin supply delta metric (red) reflects the reached market bottom. The structure of the supply delta now looks similar to 2019-2020, before the spot price surge towards the 2021 double peak cycle.
Supply delta is an indicator originally developed by Capriole Investments, and it compares the behavior of short-term and long-term investors. Supply delta is obtained from the difference between short-term investor supply (STHS) and long-term investor supply (LTHS), using the formula:
Supply delta = STHS/sma(STHS) – LTHS/sma(LTHS)
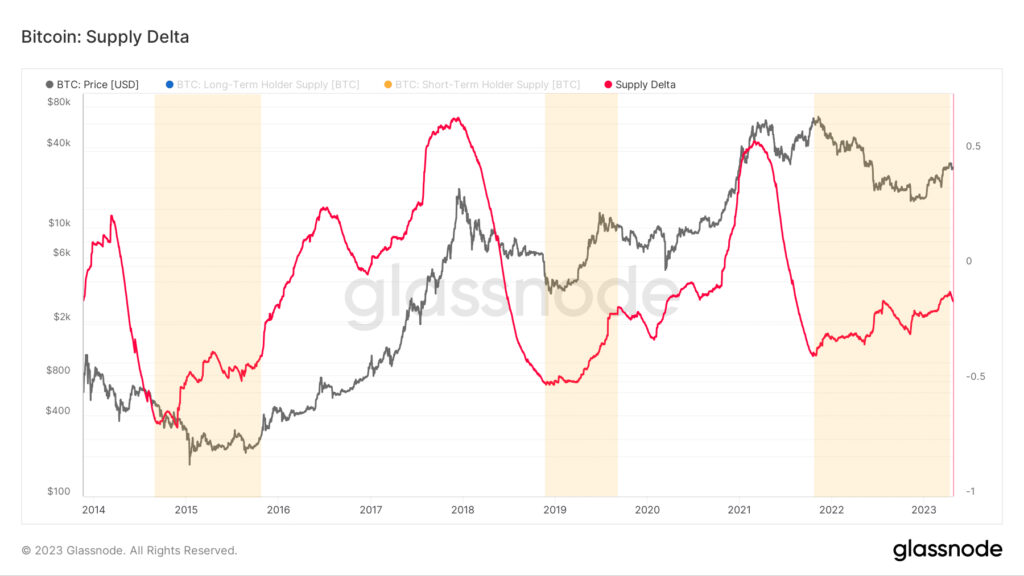
Source: Glassnode
Fed’s Final Interest Rate Hike?
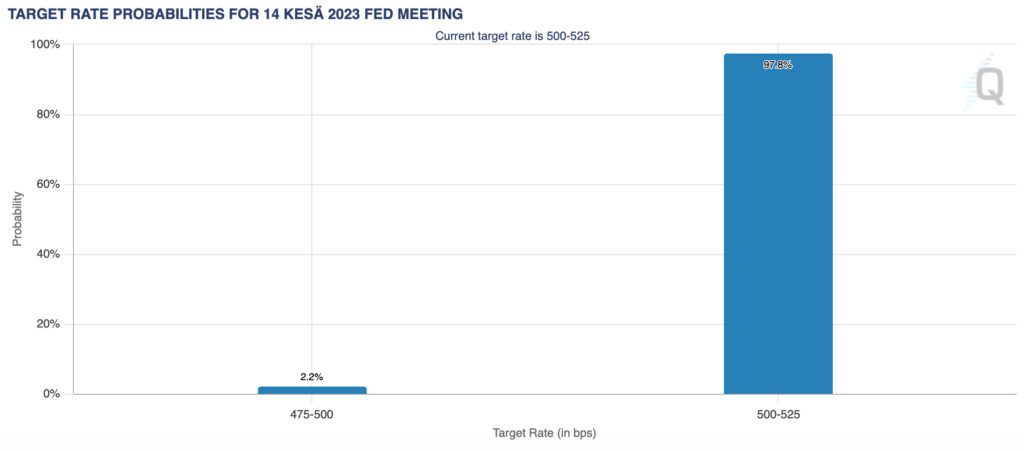
The world’s leading central bank Fed announced its latest interest rate policy on Wednesday, which ended up with an expected 25 basis point increase. The crypto market reacted moderately positively to the interest rate decision. Although the interest rate decision does not contain any drama, the market is clearly looking forward to June 14th FOMC meeting, which is widely believed to end the interest rate hikes.
According to CME data, up to 97,8 percent of investors believe that interest rate hikes have now reached their legal point, and 2,2% speculate that the Fed will even lower its interest rate policy. The market will receive the interest rate peak positively, and a rate reduction would be rocket fuel for many assets. So volatility is definitely ahead.
Source: CME
Some US analysts, such as Luke Gromen, have long speculated that the Fed will turn its monetary policy from quantitative tightening (QT) to easing (QE). However, the change of QT to the QE line is just a projection for the time being. A sudden return to the QE and an increase in liquidity would definitely strengthen the position of high-beta risk assets.
Investment strategist Raoul Pal has been analyzing cryptocurrencies and the macro market outlook. Pal estimated previously that the central bank Fed would turn its hawkish monetary policy towards a dovish one in 2023. Pal sees the spot price of bitcoin as strongly correlated with the M2 monetary aggregate (i.e., the money supply). Bitcoin’s cyclical price development has historically risen as the money supply expanded and fallen as the supply became scarcer.
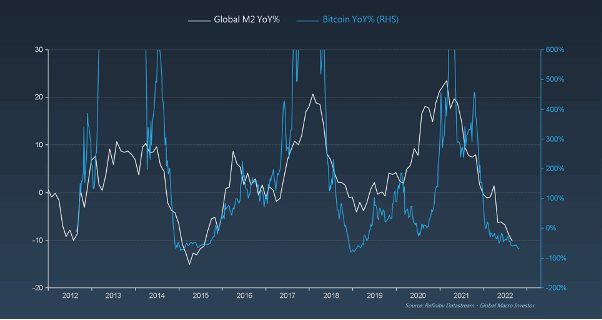
Sources: Raoul Pal, GMI
A Meme Coin Renaissance and altseason?
The TA of week 15 pondered the possibility of a new altseason, and the “prophecy” sort of came true. The early days of May have seen a possible new renaissance of “meme coins” when the cryptocurrency Pepe (PEPE) has risen more than 2000 percent since its launch. On a weekly basis alone, there is more than 600 percent upward movement.
However, Pepe’s momentum has not caught on with other meme coins, such as Dogecoin, which Elon Musk previously tried to uplift with his Twitter frenzy. It is still a very speculative token whose background or price movements are not certain. Consequently, investors should remain cautious.
Pepe (PEPE) is not currently listed on Coinmotion’s platform. However, it can be purchased through our own OTC service.
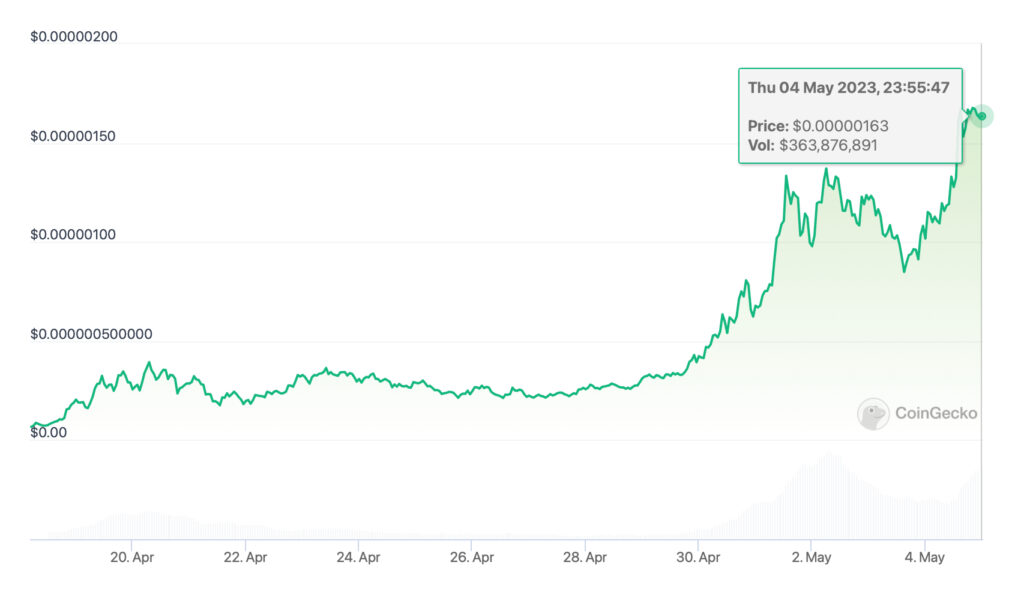
Source: CoinGecko
What Are We Following Right Now?
The debate surrounding the regulation of the blockchain industry continues to rage in the United States. Robert F. Kennedy Junior argued that excessive regulation is a mistake because it drives innovation abroad. At the same time, experts have praised the European Union’s MiCA regulation.
At the beginning of the year, American technology entrepreneur and investor Balaji Srinivasan bet on bitcoin’s rise to a million dollars. The condition was that the spot price would rise to the target price within 90 days, i.e., three months. Now Balaji has admitted his loss and allocated 1,5 million dollars, e.g., for the Bitcoin Core development team.
Validus Power Corp’s Greg Foss estimates the banking sector’s losses to reach $10 trillion. At the same time, Foss explains why bitcoin is an excellent insurance when risks escalate.

Stay in the loop of the latest crypto events
- Bitcoin Still in Accumulation Cycle, Despite the Correction
- Exploring Ethereum’s Shapella upgrade: What you need to know
- How can decentralization save us in a world driven by AI?
- Beginner’s guide: How to invest in Bitcoin
- Bitcoin Breaks the $30 000 Key Resistance Level & Ethereum’s Shanghai Upgrade
- The Market Reflects Tightening Regulatory Environment
- What has happened in the crypto market in Q1 — and what is to come?
- Why is Bitcoin rising in 2023?

The views, thoughts, and opinions expressed in the text belong to the author and not necessarily to the author’s employer, organization, committee, or other group or individual.