Technical analysis for week 26 explores bitcoin’s price performance over the summer seasons. In addition, we’ll estimate if MicroStrategy can be considered as a leading indicator for bitcoin.
Sell in May? Bitcoin’s Summer Season Compared with Q4
A well-known stock market anomaly, “sell in May,” has been derived from the historically weaker performance of the summer seasons. The said anomaly would lead us to sell assets before summer and re-allocate again during the fall. Would this anomaly also apply to the bitcoin market? Let’s find out.
The performance of bitcoin market during summer season (June – August):
2013: -0,32%
2014: -24,05%
2015: 3,32%
2016: 6,45%
2017: 97,52%
2018: -6,58%
2019: 12,28%
2020: 14,5%
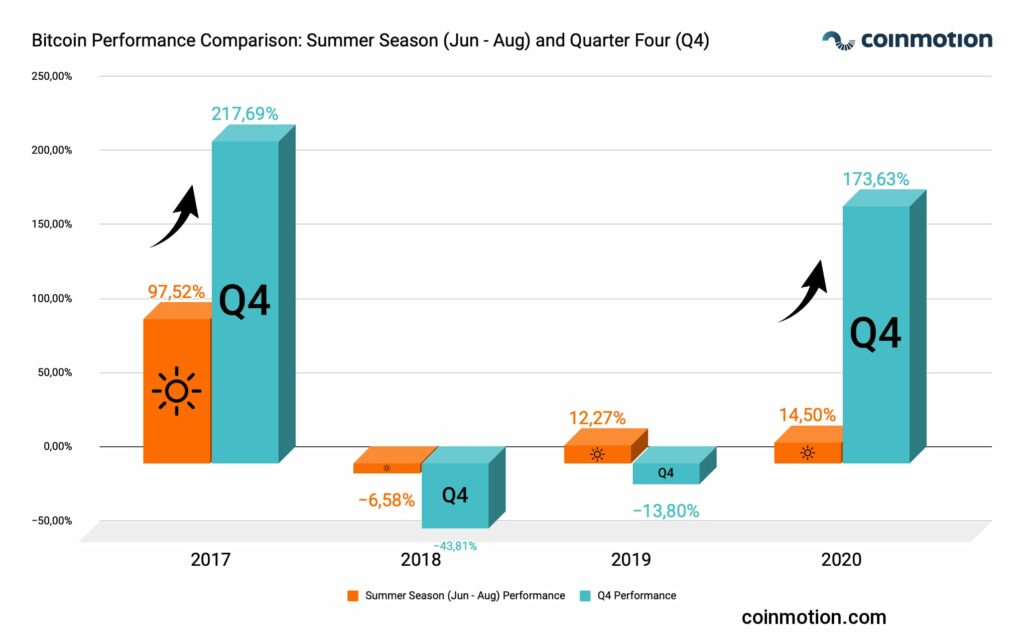
When exploring the price data of previous years, we can see that bitcoin has been performing modestly during summer seasons, benchmarked against yearly performance. Bitcoin’s price has only increased by 12,89 percent during the summer seasons between 2013 and 2020. The 2017 summer season acts as an exception: BTCUSD ascended 97,52%. The performance of the summer season has been negative in 2013, 2014, and 2018, positive results have been mediocre with the exception of 2017.
Summer Season Compared with Quarter Four (Q4)
As we mirror the summer season price performance against late-year numbers, the late quarters have clearly been more bullish. In 2017, BTCUSD climbed 97,52 percent during the summer months and ascended a further 217,69% in the last quarter. The price-performance grew incrementally again last year, rising from summer 14,5% into Q4’s 173%. As a summary, one could argue that the summer months are an eligible time window for long-term bitcoin accumulation.

Is MicroStrategy a Leading Indicator for Bitcoin?
MicroStrategy (MSTR) gathered vast attention last year as the company announced a program for acquiring bitcoin as an alternative for cash (USD) in their balance sheet. MicroStrategy’s CEO Michael Saylor has profiled himself as the de facto pro-bitcoin executive and MSTR currently holds 105 085 bitcoins in its reserves. The latest bitcoin purchase was arranged via an exotic corporate loan structure.
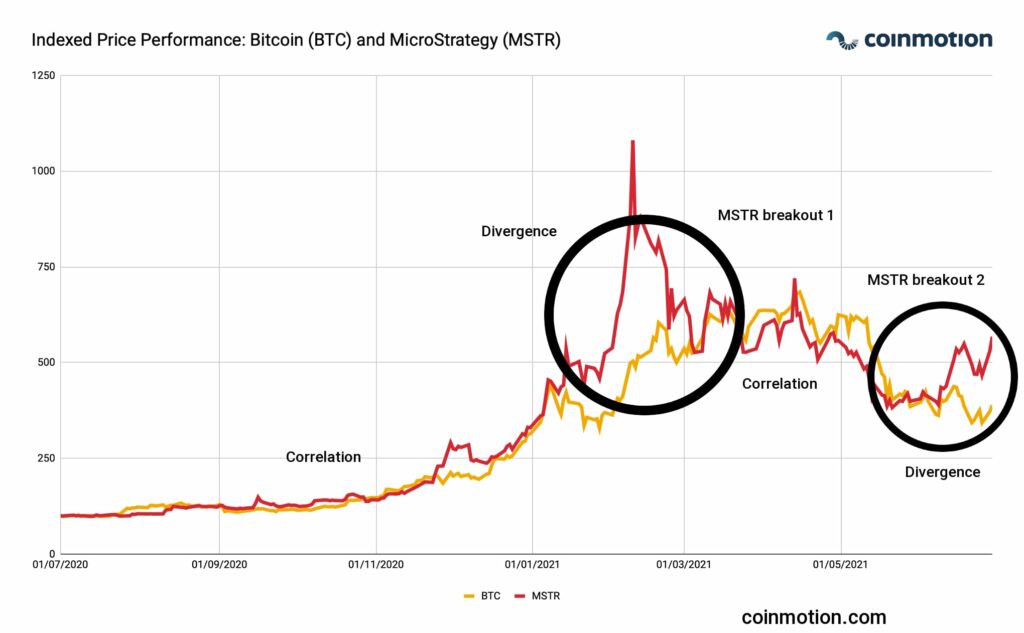
As we look at the performance of MSTR stock against bitcoin (BTCUSD), the assets have been closely correlated, with a couple of notable exceptions. During early 2021, MSTR stirred the market by rising more than 200 percent from January into February, while BTC only showcased modest numbers. In the early spring 2021 breakout, MSTR acted as a leading indicator of bitcoin. BTCUSD closely followed MSTR’s path, rising above the $60K level. MSTR and BTC became closely correlated again after bitcoin’s correlation.
MSTR surprised the markets again between quarters two and three by breaking the bitcoin correlation and rising towards a breakout. If the early 2021 anomaly would continue, MSTR might again act as bitcoin’s leading indicator.

MicroStrategy is a particularly interesting asset as it has evolved into an unofficial “Bitcoin ETF”. Furthermore MSTR is an instrument for market interpretation as it seems to lead bitcoin’s course. By the latest data, MSTR has ascended +30,56% within the last 30 days, while bitcoin has dropped -8,61%.
Lebanese Inflation and BTCUSD
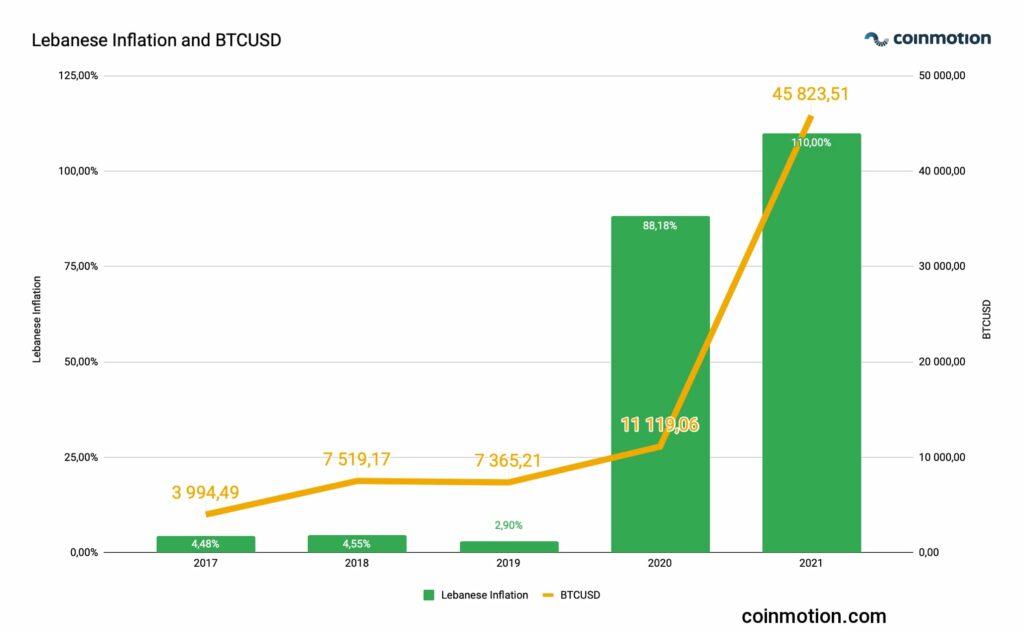
The Lebanon pound (LBP) has continued to weaken against the U.S. dollar (USD) and bitcoin (BTC), while the country edges closer to total economic chaos. The inflation is estimated to be over 100 percent on a yearly basis and LBP has weakened >90% against USD since late 2019.
The Lebanese pound is a textbook example of the weakening state of emerging market national currencies. The leading central banks are using large national currencies, like USD, EUR, CNY, and JPY, as part of their easing strategies. These easing programs have been effective for leading economies, while many smaller nations are facing increasing challenges.

