

The technical analysis of week 15 charts the latest market movements over a seven-day period, using technical and fundamental indicators. We’ll explore bitcoin’s parabolic advance and the Material Indicators’ heat map. We also consider the possibility of an “altseason” and review our successful triple bottom structure prediction.
The crypto market has climbed in moderately positive moods since last week, with the leading cryptocurrency, bitcoin strengthening by 0,2 percent. Ethereum, on the other hand, has climbed more than 10 percent in a week, mainly driven by the Shapella (Shanghai + Capella) update.
Read more: Exploring Ethereum’s Shapella upgrade: What you need to know
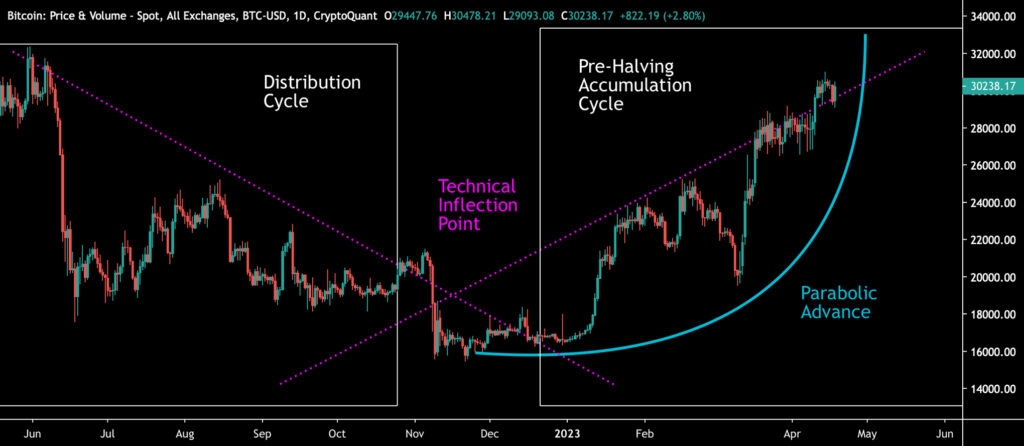
From a purely technical point of view, bitcoin passed its critical inflection point at the turn of the year, where the descending and ascending trend lines meet (pink). The point acts as a watershed and defines the market from 2021 until the halving year of 2024.
At the same time, bitcoin has formed a parabolic trendline (turquoise) from December 2022 until today. However, the parabola is getting steeper now, demanding even bigger surges from the spot price. The break of the turquoise parabola during the spring would generate short-term selling pressure.
Sources: Timo Oinonen, CryptoQuant
In the broader picture, bitcoin’s market behavior can be segmented into accumulation and distribution phases (white), which together form a multi-year series of cycles. Institutional money has traditionally favored accumulation cycles, while retail investors have been active in distribution cycles. Bitcoin’s history is also defined by halving events, which are always preceded by a pre-halving accumulation cycle (white).
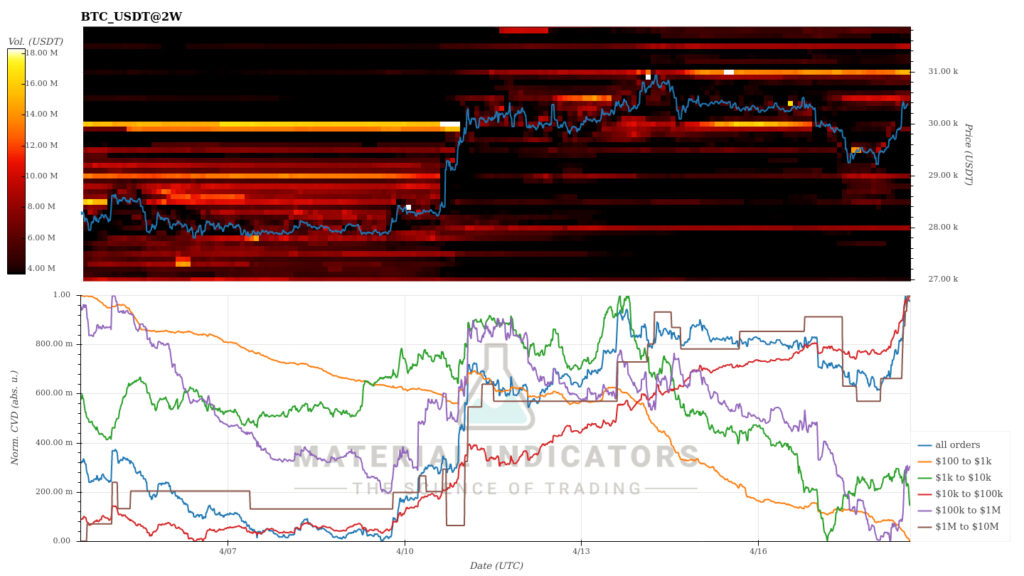
Material Indicators’ heat map shows how bitcoin fell from $30 000 to $29 000 at the beginning of the week when the buy wall disappeared. However, new buying pressure has now been found below the $30K level, which pushed bitcoin over $30 000 again. Above $31 000 currently lies a moderate sell wall.
Source: Material Indicators
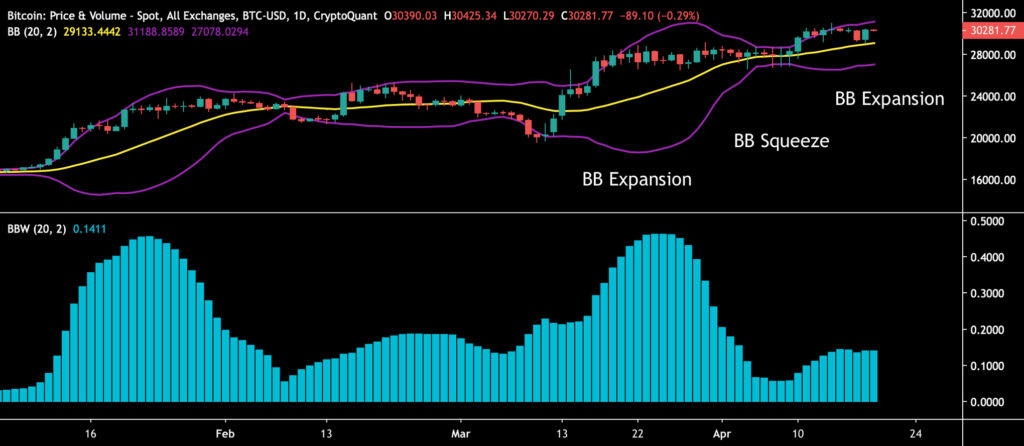
Bitcoin’s Bollinger bands (purple) squeezed the spot price up last week (BB Squeeze). Now it seems that an expansion phase is ahead, which is characterized by a sideways movement of the spot price (BB Expansion).
Sources: Timo Oinonen, CryptoQuant
The selling pressure speculations towards Ethereum’s (ETH) upgrade did not materialize, and the cryptocurrency is clearly leading the price development of large-cap assets. The market for smaller tokens is also clearly waking up, with Chainlink (LINK) rising almost 17 percent in a week. At the same time, Litecoin (LTC) is up 8 percent in a week and has around 100 days until the halving event.
Read more: What is Chainlink? LINK Crypto Guide
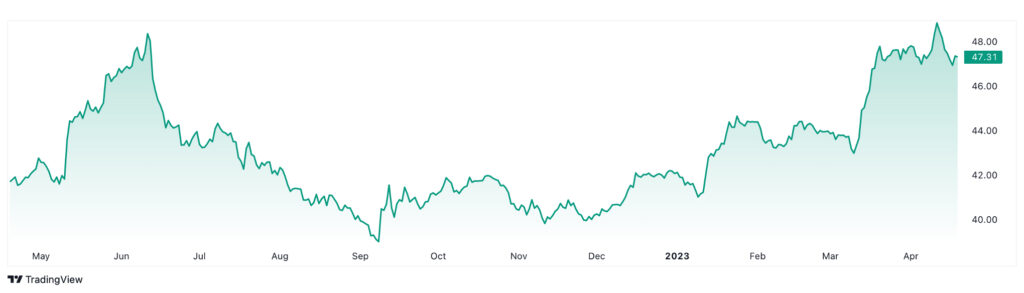
The price development of the mainstream market has been slower, with the S&P 500 index rising by one percent and gold weakening by about half a percent. The technology index Nasdaq-100 has been in a tailwind in April, rising more than 20 percent since the beginning of the year.
7-Day Price Performance
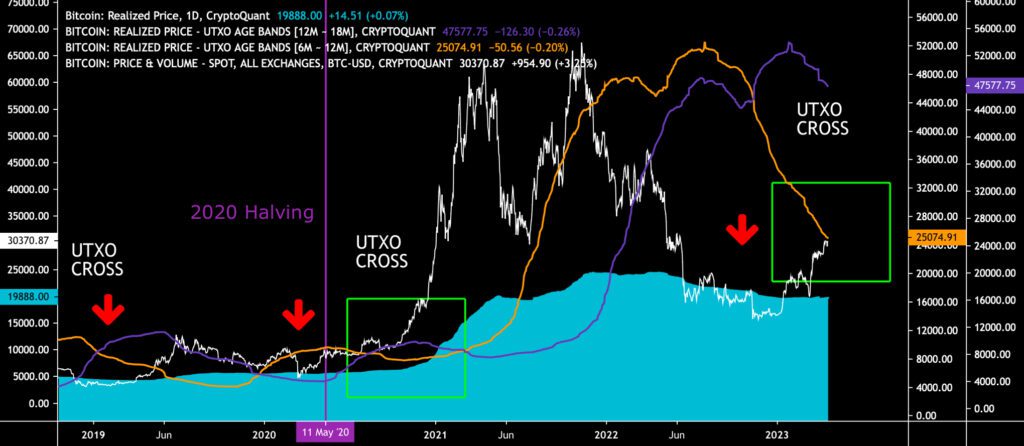
Bitcoin Seems to Repeat its 2020 UTXO Pattern
Winged by the price increase, bitcoin is now making a clear divergence to the turquoise wave of the realized price, which served as a critical battleground at the turn of 2022 and 2023. The realized price has been seen as a watershed in the market as it represents the average price of all bitcoin purchases. At the same time, the spot exceeding the realized price shows that bitcoin investors are making a profit on their investments.
The realized price UTXO waves have shown the market bottom of bitcoin for many years. In 2019, the decline of the 6M-12M wave (orange) below the 12M-18M wave (purple) (utxo cross) indicated a market bottom. The same structure was realized again in 2020. Additionally, the phenomenon was repeated at the end of 2022, when 6M-12M clearly sank below 12M-18M, while their divergence increased. The meeting of the UTXO waves at the end of 2022 can therefore be seen as confirming the market bottom.
Sources: Timo Oinonen, CryptoQuant
Now bitcoin is implementing a setup reminiscent of 2020, where the 6M-12M wave (orange) of realized price coming from above intersects with the spot price coming from below. In the chart above, the layout of 2020 is represented by the green area on the left and the current situation on the right. The end result of that encounter in 2020 was a parabolic price rally, which continued well into 2021.
Bitcoin’s Dominance and The Possibility of an Altseason
With bitcoin flexing its almost 100 percent YTD gains, many traders are now waiting for the movements of alternative cryptocurrencies, i.e., altcoins. Even though bitcoin’s relative dominance has increased throughout the spring, its dominance growth can be assumed to be limited to 50 percent.
In recent years, the ceiling of bitcoin’s dominance has remained strictly at 50 percent, mainly due to retail participation in the bull cycles. As bitcoin reaches critical momentum, demand for altcoins correlates, leading to market saturation and a sideways movement of dominance. These factors together enable the birth of an “altseason.”
Source: TradingView
According to the efficient market hypothesis (EMH), asset prices reflect all available information. However, especially speculative higher beta tokens counter this hypothesis. There is a clear information asymmetry in the market, where certain parties have so-called better information. In addition, particularly new crypto investors prefer new tokens due to their perceived novelty value.
Although Ethereum’s Shapella update exceeded market expectations, at least the smart contract platform is not yet developing a flippening situation for bitcoin. Currently, Ethereum’s market cap is 42,7 percent of bitcoin’s, at around $250 billion. Bitcoin’s market cap remains at its sovereign level of $588 billion.
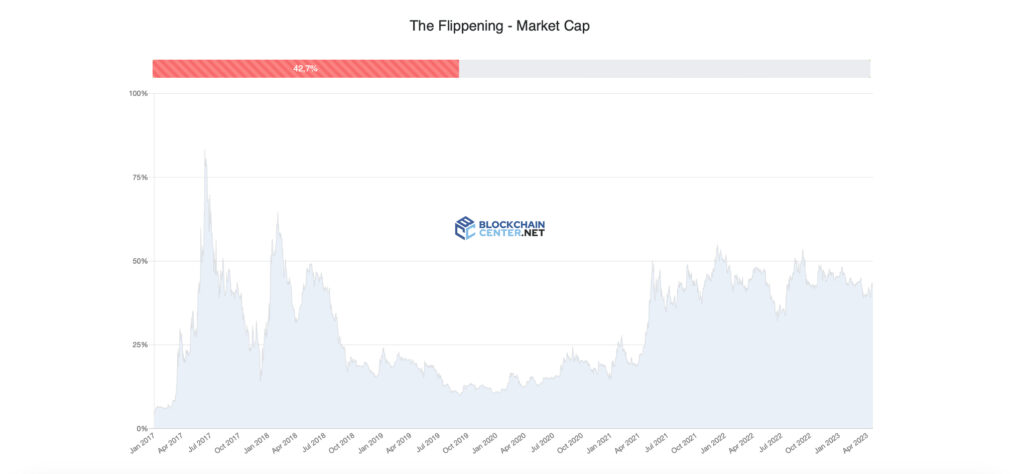
Source: Blockchaincenter
Our Triple Bottom Structure Prediction was Recently Confirmed
The triple bottom structure, based on the number of active addresses, is now clearly confirmed. We presented the model in the previous TA of week nine, and the graph of active addresses (white) now rises outside the turquoise area.
On-chain data from 2018 and 2019 shows how the number of active addresses (30-day weighted moving average, 30WMA) generated three individual bottoms (turquoise, left) as part of the 2018-2019 reversal process. The 2021-2023 cycle shows a similar structure (turquoise, right) as active addresses reached three individual lows as well.
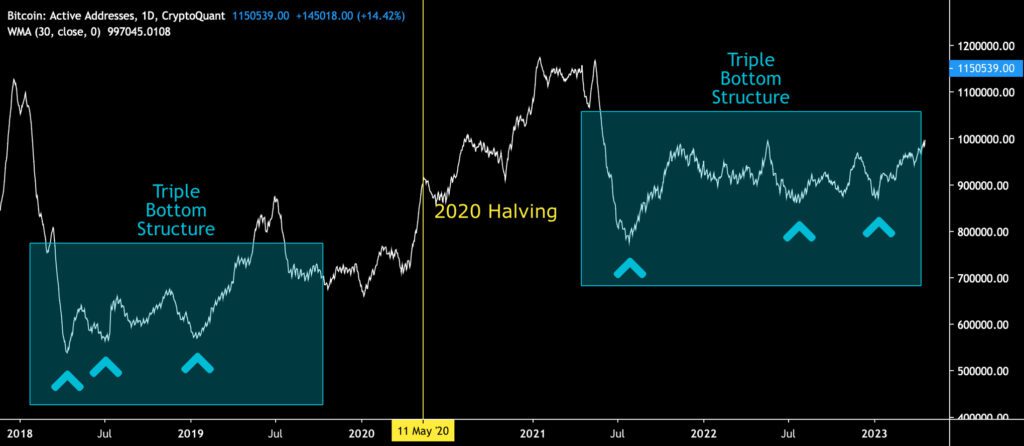
Sources: Timo Oinonen, CryptoQuant
We can observe how the number of active addresses started to decline already in the summer of 2021, effectively acting as a leading indicator of the spot price. Therefore, the spring 2021 price action can be considered a de facto peak supported by fundamentals, while the November 2021 peak can be considered “secondary.”
In summary, with bitcoin following the triple bottom structure of the last major cycle, the gradual price increase will likely continue during 2023. Bitcoin’s current “fair price” is at $38 736, which is aligned with our latest price projection of $46 092.
What Are We Following Right Now?
Solana Mobile says it will start shipping the Saga smartphone on April 20th. The retail price of the device is 1000 dollars in the USA, i.e., around 912 euros in the euro area. In connection with the shipping, Solana has shed light on the functionality of the device and the ecosystem.
The new owner of Saga will receive an NFT called Saga genesis token, which is promised to guarantee access to exclusive content and offers. A Saga user is also promised a starter pack that includes a set of 20 USDC and 0,01 SOL tokens for transactions. We are closely following the development of this crypto native smartphone.
In his interview with Kitco, investment expert Lawrence Lepard shares his views on bitcoin and why the cryptocurrency can reach $100 000 next year.

Bitcoin OG Matthew Mezinskis, known for his Crypto Voices podcast, explains how central banks have historically prevented free banking. In addition, Mezinskis shares his views on the state of the credit market.

Stay in the loop of the latest crypto events
- Exploring Ethereum’s Shapella upgrade: What you need to know
- Bitcoin Breaks the $30 000 Key Resistance Level & Ethereum’s Shanghai Upgrade
- How can decentralization save us in a world driven by AI?
- The Market Reflects Tightening Regulatory Environment
- What has happened in the crypto market in Q1 — and what is to come?
- MicroStrategy as Market’s Leading Indicator
- Why is Bitcoin rising in 2023?
- Bitcoin Retains its Momentum Amid the Chaos
- Aave launches native stablecoin GHO

The views, thoughts, and opinions expressed in the text belong to the author and not necessarily to the author’s employer, organization, committee, or other group or individual.