


Week 31’s technical analysis assesses weekly-level price movements and macro market trends. Additionally, we compare the price development of bitcoin to other asset classes and delve into the growing balance sheet of MicroStrategy.
The cryptocurrency market has gained positive momentum in a week, while still remaining within its sideways channel. Compared to other asset classes, bitcoin’s 78 percent price growth since the beginning of the year can be considered excellent. The ARK Innovation Fund (ARKK), focusing on disruptive technology, has risen by 39 percent year-to-date, closely correlating with the technology index Nasdaq 100. The S&P 500 stock index has strengthened by 17 percent since the beginning of the year, while gold, sharing characteristics with bitcoin, has remained below a five percent growth figure.
YTD Price Performance
Bitcoin 78 %
ARK Innovation ETF 39 %
Nasdaq 100 39 %
S&P 500 17 %
Gold 4,8 %
In addition to the positive price development, bitcoin’s value proposition is supported by several macro-level factors. The recent Litecoin halving event, which took place last week, precedes bitcoin’s own halving event in April 2024, expected to act as a catalyst for price increase. Furthermore, long-awaited ETF aspirations are likely to become a reality with a high probability. As assessed by Tuur Demeester of Adamant Research eight years ago, Bitcoin continues to be an investment with an unmatched risk-to-reward ratio.
“We maintain that the risk-reward ratio for Bitcoin the currency is currently the most favorable of any investment in the world.” – Adamant Research, November 2015
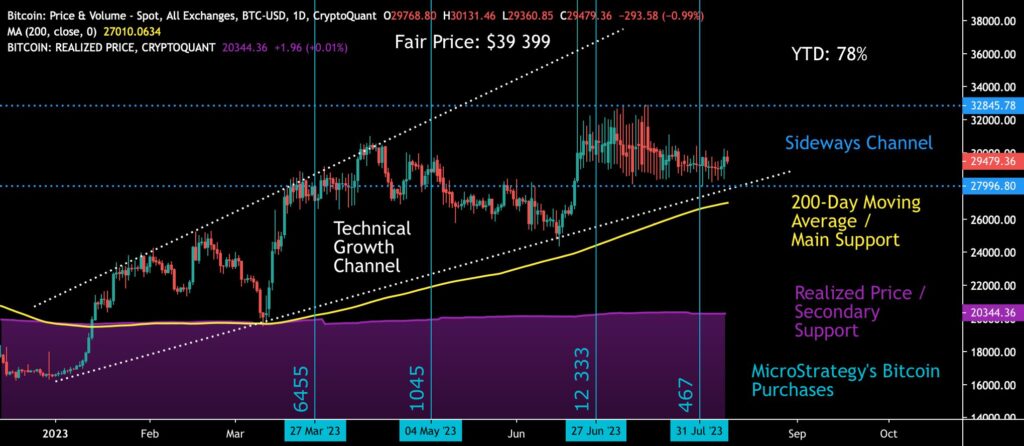
From a purely technical perspective, bitcoin continues to follow its ascending channel (white), even though the price has been oscillating sideways since the end of June. The spot price receives support from the 200-day moving average (yellow) and from the realized price wave below it (violet). The increasing purchases by MicroStrategy during spring and summer (turquoise) can be interpreted as a signal of returning institutional appetite.
Sources: Timo Oinonen, CryptoQuant
The Material Indicators’s heat map shows increasing demand between $28 250 and $29 150, thereby reducing short-term selling pressure. Simultaneously, the relative affordability of bitcoin is attracting accumulators.
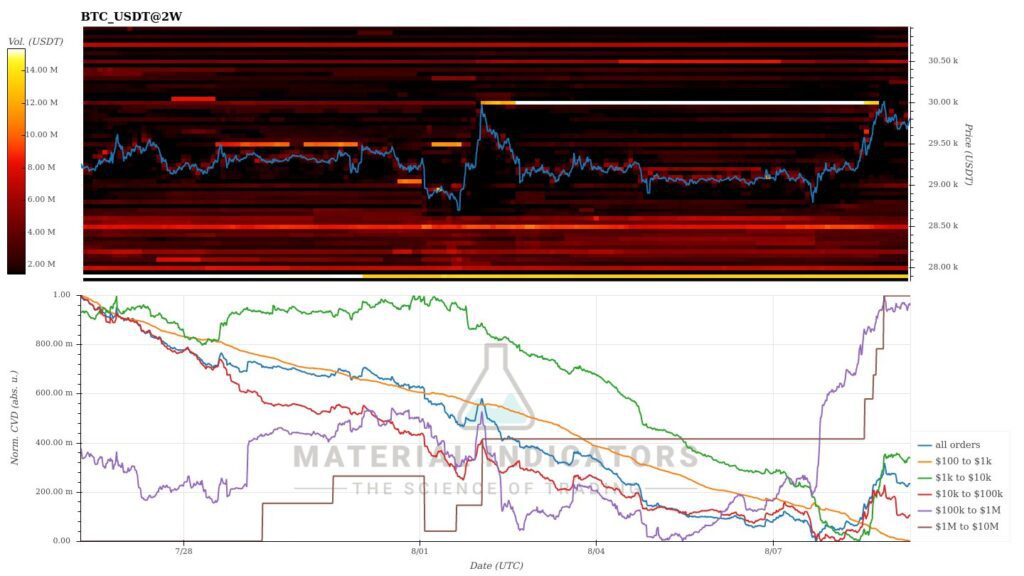
Source: Material Indicators
The cryptocurrency market has continued within its sideways channel since last week, still achieving positive price figures. Bitcoin strengthened by about one percent, in the familiar correlation with Ethereum. XRP, which previously benefited from the SEC-related classification rally, declined by 4,7 percent, reflecting a cooling down of the Ripple hype.
Seven Day Price Performance
The SEC’s early June segmentation continues to serve as a market watershed. The commission divided cryptocurrencies and tokens into two main categories, with “commodity tokens” in one group and “security tokens” in the other. This radical classification originally placed only bitcoin and Ethereum in the commodity group, thus safeguarding their status.
Now, XRP can also be included in the category of commodity-classified tokens. In July, speculation intensified around Stellar, with investors speculating that the cryptocurrency might end up on the commodity classification list. However, as of now, the SEC has not announced its stance on Stellar.
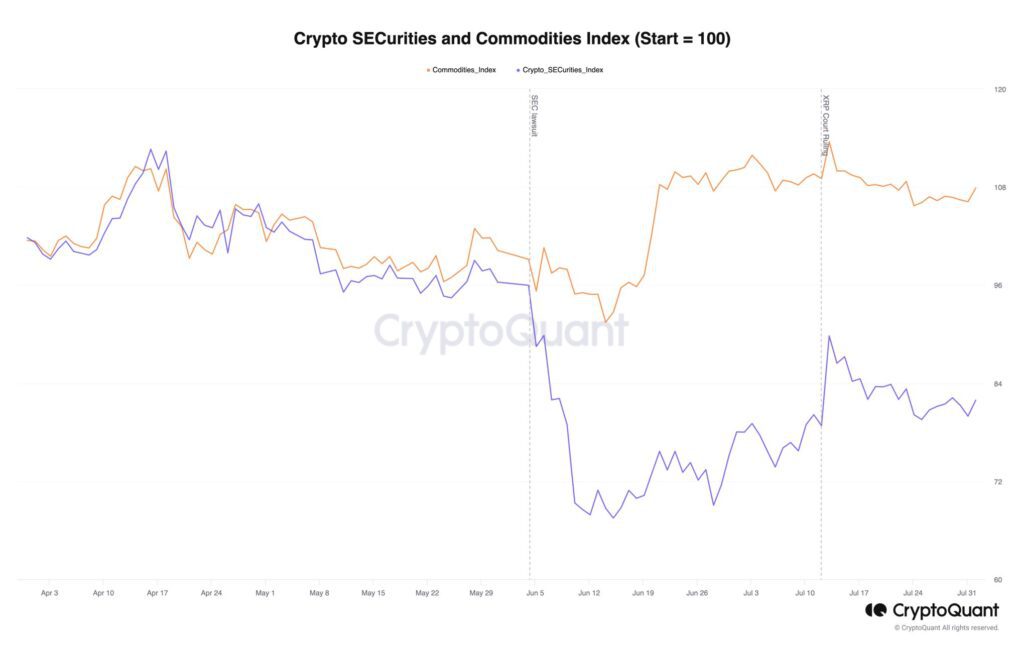
Source: CryptoQuant
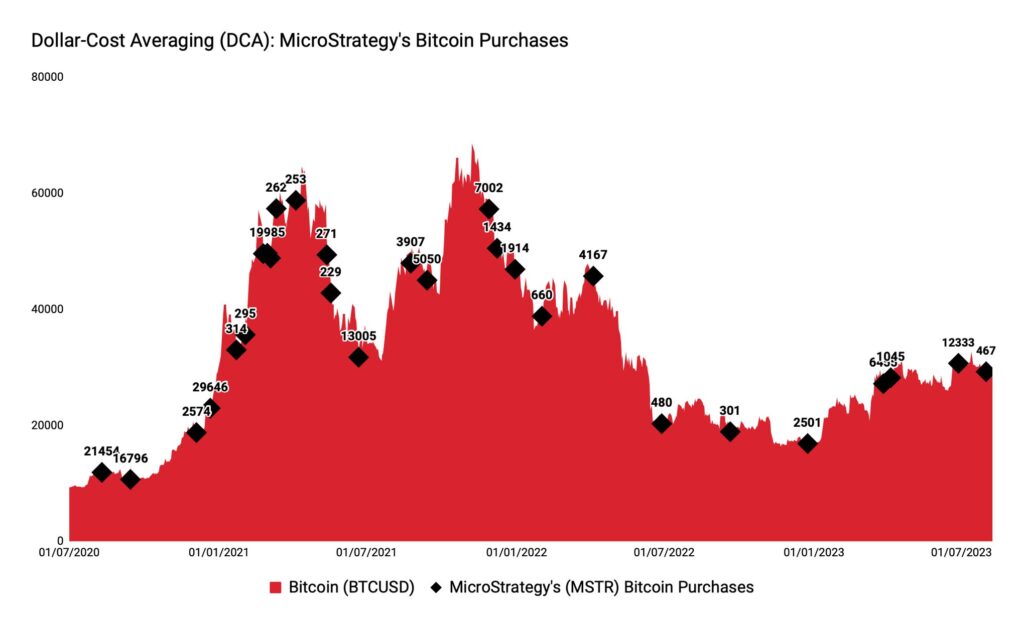
Saylor Enters the Accumulation Mode, Again
MicroStrategy, led by Michael Saylor, announced that it had increased its holdings by 467 bitcoins in July, raising the total assets under management to 152 800 units. MicroStrategy stated that it has used a total of 4,53 billion U.S. dollars to acquire the 152 800 bitcoins, at an average price of $29 672 per coin. With the current spot price at $29 479, MicroStrategy is operating on the brink of its bitcoin-based break-even.
Throughout this year, MicroStrategy has accelerated its accumulation pace, acquiring a total of 20 300 units since January 1st. Compared to 2022 when the company added 8109 BTC to its balance sheet, the year-on-year growth by August 2023 has exceeded 150 percent. As MicroStrategy’s acquisitions gain momentum towards the end of the year, the growth over the previous year might amount to several hundred percent.
Since the beginning of the year, MSTR stock has surged by 161 percent, approximately doubling in relation to bitcoin. MicroStrategy has often been considered a leading indicator for bitcoin, acting as a technical magnet for BTCUSD. The intensification of the company’s accumulation pace also signals preparation for significant future events, including the projected halving event of next April and the probable ETF decision(s) by the U.S. Securities and Exchange Commission (SEC).
Both BTC and MSTR are reflexive asset classes, aligning with George Soros’s reflexivity theory. Soros’s theory addresses the impact of positive feedback loops on investor expectations and realities, where differences between the two can lead to price trends significantly deviating from equilibrium prices.
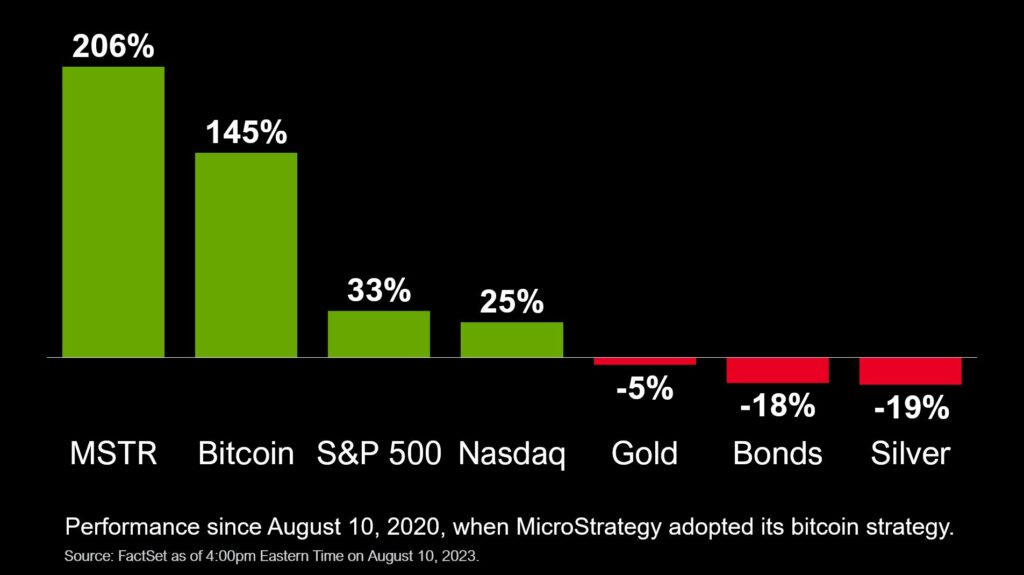
Source: Michael Saylor
The chart presented above by Saylor compares the performance of different asset classes since MicroStrategy’s initial bitcoin purchases on August 10, 2020. Over a little more than three years, MSTR stock has risen by 206 percent, while bitcoin has gained 145 percent. The S&P 500 stock index has climbed by 33 percent, with the technology-weighted Nasdaq reaching 25 percent. Somewhat surprisingly, precious metals have significantly underperformed within the three-year timeframe, with gold falling by 5 percent and silver by 19 percent. Although gold shares many characteristics with bitcoin in nominal terms, its investment narrative could be deemed questionable.
Source: Coinmotion Research
The chart above, constructed by Coinmotion Research, provides an overview of MicroStrategy’s bitcoin acquisitions. The company accumulated actively in 2020 and 2021, but its purchases were modest in the past year. In 2023, the pace has accelerated again, with the company amassing a total of 20 300 bitcoin units since January.
Michael Saylor and his company MicroStrategy, founded in 1989, have emerged as pioneers in institutional Bitcoin investment. The turning point for the company occurred in July 2020 when Saylor announced the replacement of the company’s dollar reserves with bitcoin and alternative assets. Saylor is also known for his Bitcoin thesis, which encompasses defensive, opportunistic, and strategic arguments.
Bitcoin Bypasses Its Historical Golden Cross Setup
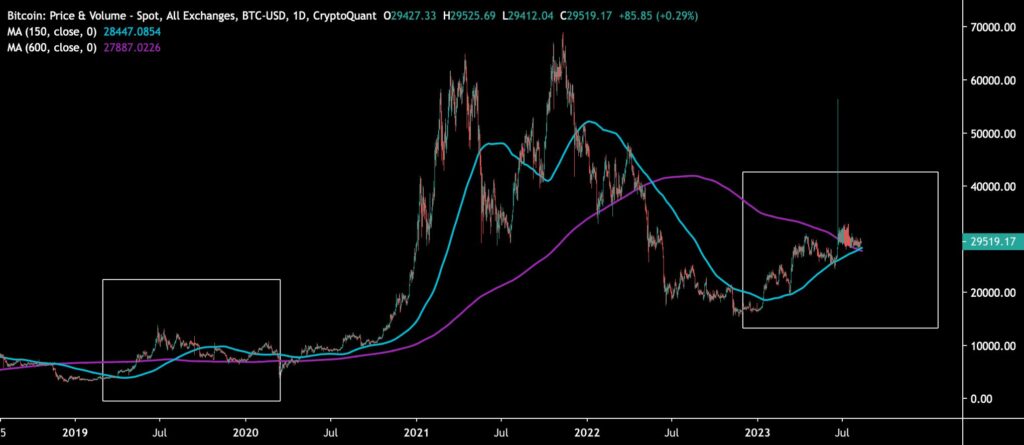
Bitcoin, which has been trading in a sideways channel for over a month, is approaching a new “golden cross,” formed by the convergence of the 150-day (turquoise) and 600-day (violet) moving averages. The last occurrence of this phenomenon was in 2019, and it acted as a catalyst for price growth in the following year. Drawing parallels with Hyman Minsky’s theory, prolonged stable price development leads bitcoin towards new volatility.
“Stability leads to instability. The more stable things become and the longer things are stable, the more unstable they will be when the crisis hits.” – Hyman Minsky
Before the current golden cross, bitcoin encountered a “death cross” in 2022. In the death cross of 2018, the 150-day moving average fell below the 600-day moving average, indicating the formation of a market bottom. While the golden cross and death cross are approximate indicators, they still provide insights into the overall direction of the market.
Sources: Timo Oinonen, CryptoQuant
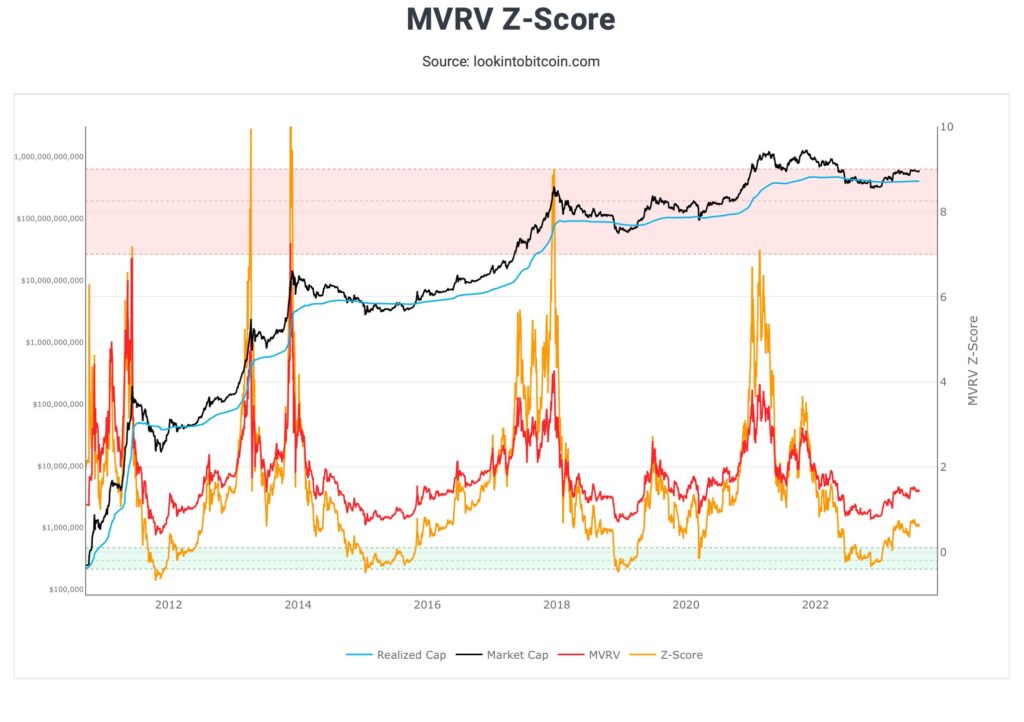
MVRV Indicates an Ongoin Accumulation Phase
The MVRV indicator (red), representing bitcoin’s valuation, has risen to 1,44 by the beginning of August, reflecting the market’s accumulation phase. The MVRV ratio remained below one (1) from June to January, over a six-month period, indicating significant undervaluation. The current value can be considered moderate, while also reflecting the inexpensive spot price ahead of the spring 2024 halving.
Source: LookIntoBitcoin
The MVRV indicator was developed by David Puell and Murad Mahmudov in 2018. The Puell Multiple, which has also been used in technical analyses, is named after David Puell. Bitcoin is considered overvalued when the MVRV surpasses a value of 3,7. Conversely, MVRV indicates bitcoin’s undervaluation when it falls below a value of 1.
What Are We Following Right Now?
Led by Michael Saylor, the Bitcoin Mining Council has estimated that mining power has increased by 70 percent from last year. According to the council’s assessment, mining efficiency has improved by 24 percent over the past year, and the share of green energy has grown by 60 percent. These estimates align with the positive findings of a recent report by KPMG.
Renowned hedge fund manager Mark Yusko’s perspective on the direction of the Bitcoin market. Yusko believes that the cryptocurrency will rise to over $100 000, indicating a 400 percent upward trajectory.

Does BlackRock’s ETF fund trigger a phenomenon known as “hyperbitcoinization”?
