

The technical analysis of week 49 assesses recent price developments and the potential approach to bitcoin’s cycle bottom. In addition, we dive into the Dow theory and its application to the interpretation of the bitcoin market. We also go through the Fed’s upcoming FOMC meeting and the stock-to-flow model.
Bitcoin Close to The Technical Cycle Bottom
The digital asset market has mostly moved sideways over the past seven days, with the spot price of the leading cryptocurrency gaining 0,1 percent. The market is still in a rather pessimistic mood after the FTX crisis, but at the same time, the sentiment is curious about the FOMC meeting on Wednesday 14th of December. The Fed is expected to raise the key interest rate by 50 basis points, which would be a clear change from the previous 75 basis point hike line. At the same time, a speculative increase of 25 basis points is also on the table, which would positively surprise the market.
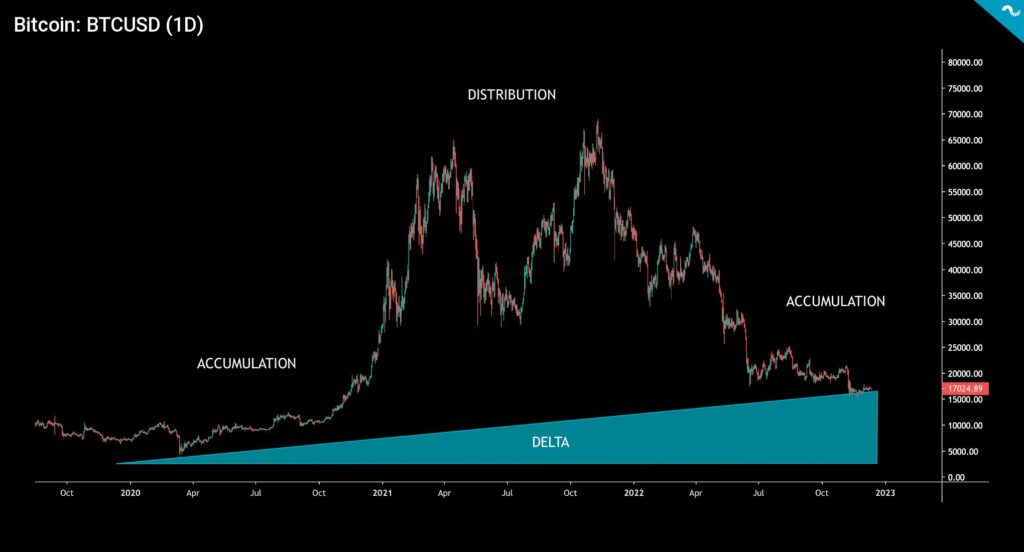
Bitcoin is clearly in a technical accumulation cycle, having passed the distribution cycle of the 2021 double-top structure. If the parabolic price development of the end of 2020 and the beginning of 2021 is ignored, Bitcoin is still in a linear upward angle (delta) from 2020. According to the derivative exchange Deribit, the maximum pain level for bitcoin derivatives at the end of the month is at $19 000, which would mean a price premium of about 10 percent to the current level.
Investment strategist Raoul Pal sees bitcoin reaching a cyclical bottom while the leading cryptocurrency is more oversold than ever in history according to him. In his newsletter last week, Pal estimates that the Fed is turning its hawkish monetary policy towards a dovish one. Quantitative tightening (QT) would therefore be replaced by quantitative easing (QE). Pal sees the spot price of bitcoin as highly correlated with the M2 monetary aggregate (i.e., money supply).
In addition to bitcoin, ethereum and litecoin have gone sideways in the week, each weakening by a percentage on either side. Higher beta tokens have fallen by several percent, and LINK dropped more than 10 percent to the negative territory. The sideways trend is also strongly visible in stocks, with the S&P 500 index falling to -0,2%. Gold is also in an almost sideways angle since last week.
7-Day Price Performance
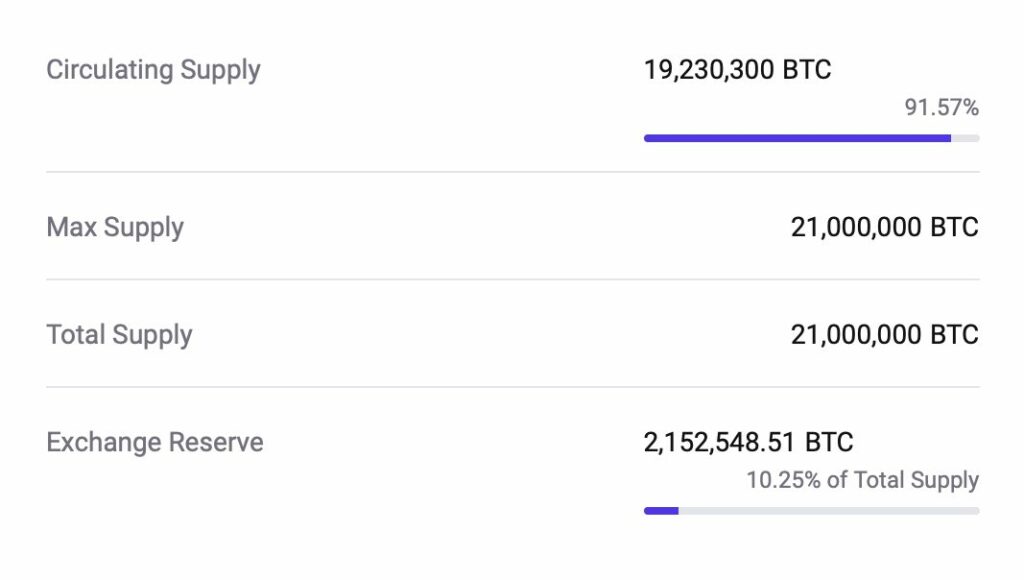
According to CryptoQuant’s data, the circulating supply of bitcoin is already 19,23 million native units or 91,57 percent of the theoretical maximum supply. As many know, the maximum supply is 21 million, which is practically never reached due to lost bitcoin units. The combined reserves of the exchanges are 2,15 million units or 10,25 percent of the bitcoin supply. The bitcoin reserves of the exchanges have decreased considerably this year due to customers’ backup measures. However, it is good to remember that Coinmotion always keeps customer funds safe and separate from the company’s own funds. As a registered virtual currency service provider and payment service institution, Coinmotion is also obliged to act in this way.
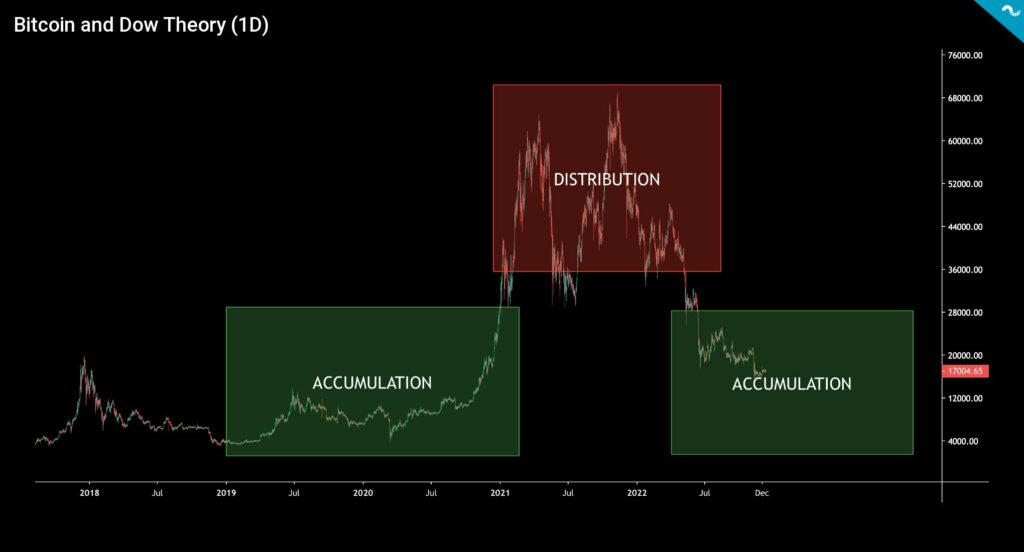
Bitcoin and Dow Theory
The Dow theory, known from the stock market, has been considered the defining theory of technical analysis. Named after its developer Charles Down, the aim of the theory is to identify long-term trends in the prices of asset classes. In a simplified way, the Dow theory divides market movements into three phases: The accumulation phase, the absorption phase, and the distribution phase. Although the Dow theory was initially used to interpret the stock market, it can also be applied to digital assets.
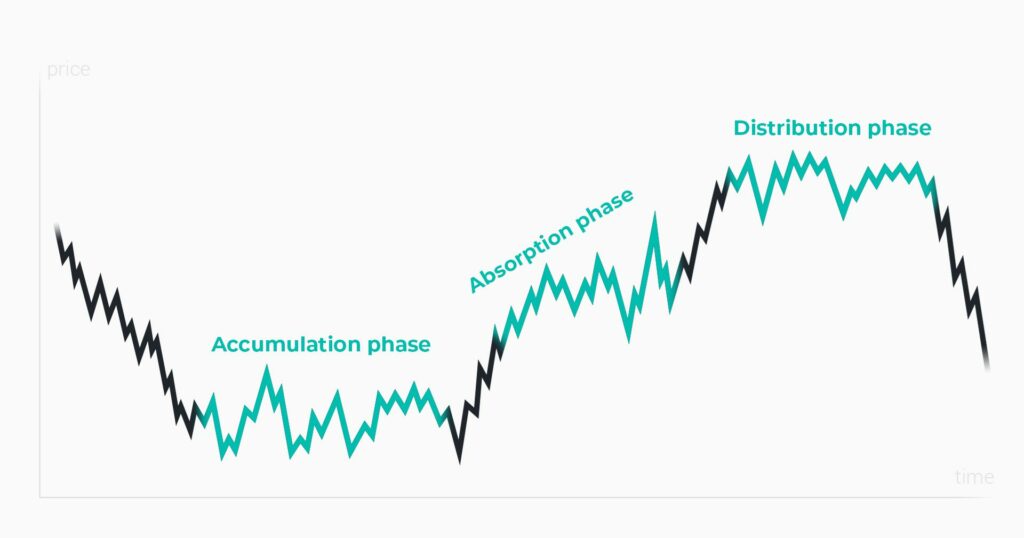
Applying the Dow theory, bitcoin’s price development over the last couple of years can be divided into accumulation and distribution cycles. The accumulation cycle (green), which started in 2019, lasted until the “DeFi summer” of 2020 and culminated in the parabolic price development at the end of the year. The year 2020 was also known for Michael Saylor’s Bitcoin theses, with which he attracted numerous institutions and smart money to bitcoin allocations.
The 2021 cycle (red) is called the distribution cycle, during which a considerable amount of retail money flowed into the market. The price development in 2021 was exceptional with its double-top structure, and during that cycle, there was also a lot of quantitative easing related to the COVID crisis. During the QE era, the cheap dollar found its way into all asset classes. After the Fed’s announced tightening of monetary policy in early 2022, the spot market began to decline significantly, and bitcoin has weakened by -64 percent since the beginning of the year. With the weakening of the spot price, we are again in a new accumulation cycle (green).
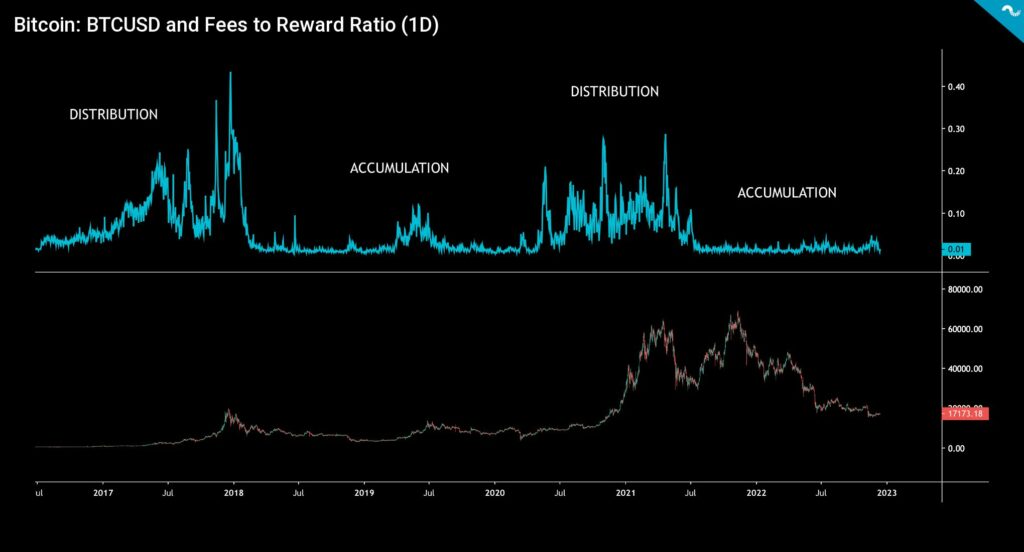
Dow cycle theory can also be applied to block reward data. The latest blockchain data shows how transaction costs as a percentage of block rewards have remained low since the May 2021 correction. The on-chain data of transaction costs can be interpreted as forming two market cycles: The accumulation cycle and the distribution cycle. In particular, institutions and smart money have been activated during accumulation cycles, while retail investors have preferred later distribution cycles.
The on-chain data of 2017 shows the year is clearly a distribution cycle, and the 2017 distribution cycle was followed by the two-year accumulation cycle in 2018-2019. Between them was a smallish distribution phase in the summer of 2019. The accumulation cycle of 2020 was followed by a significant distribution cycle from the end of 2020 to 2021, which was characterized by parabolic spot prices. The current accumulation cycle will reach the length of 24 months next year, and according to on-chain data, there is yet another distribution cycle ahead.
Focus on FOMC
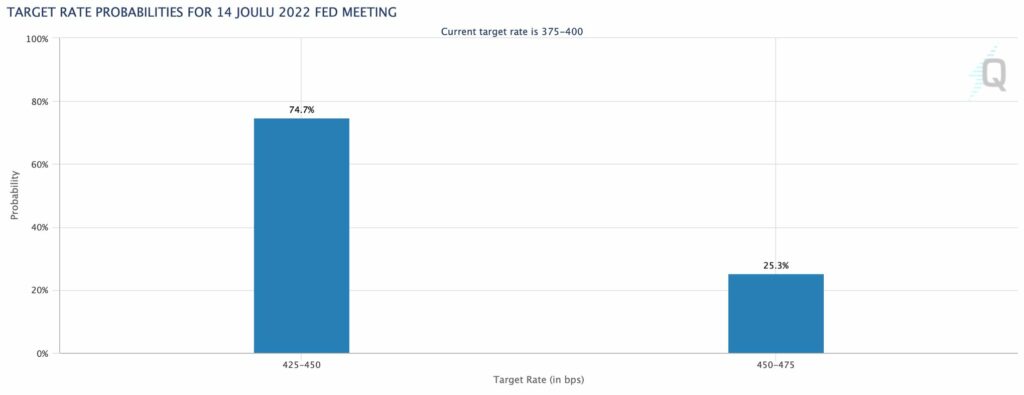
The Fed’s next FOMC meeting is scheduled for Wednesday. After Powell’s previous dovish rhetoric, CME sees a 50 basis point rate hike of 74,7 percent. At the same time, the probability of a 75 basis point increase is estimated to be only 25,3%.
A 25 basis point interest rate hike scenario would be unlikely, but it would have an exceptionally positive market reaction. The market will also react positively to the expected 50 basis points scenario. A rate hike of 75 basis points seems an unlikely scenario, and its impact on the market would clearly be negative.
25 BPS: 30% priced in. Exceptionally positive reaction
50 BPS: Priced in. Positive reaction
75 BPS: 50% priced in. Negative reaction
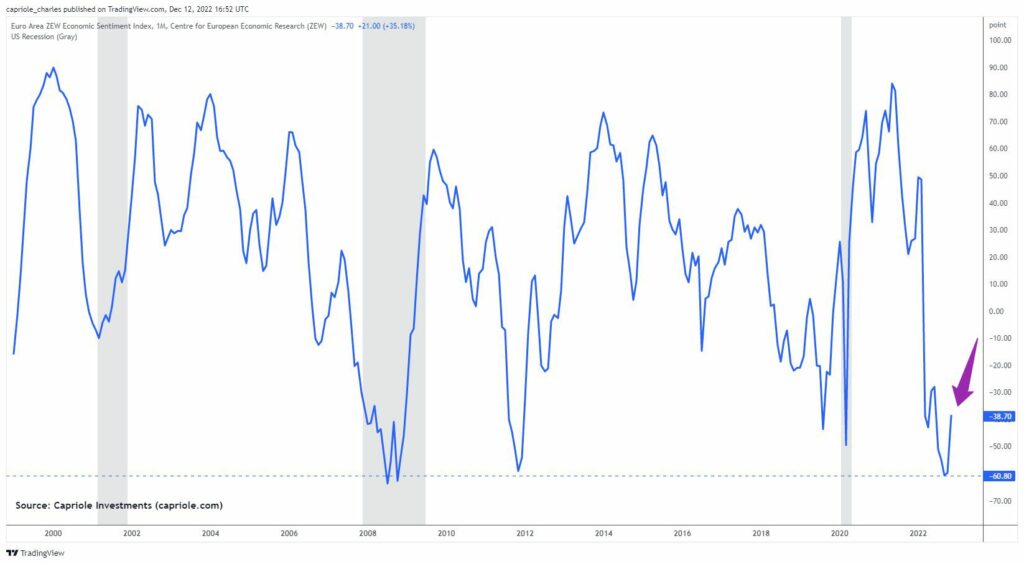
Capriole Investments notes that European market sentiment is at its lowest level since the 2008 subprime crisis. Europe’s macro sentiment is particularly weighed down by the energy market, which has pushed many countries to the brink of crisis.
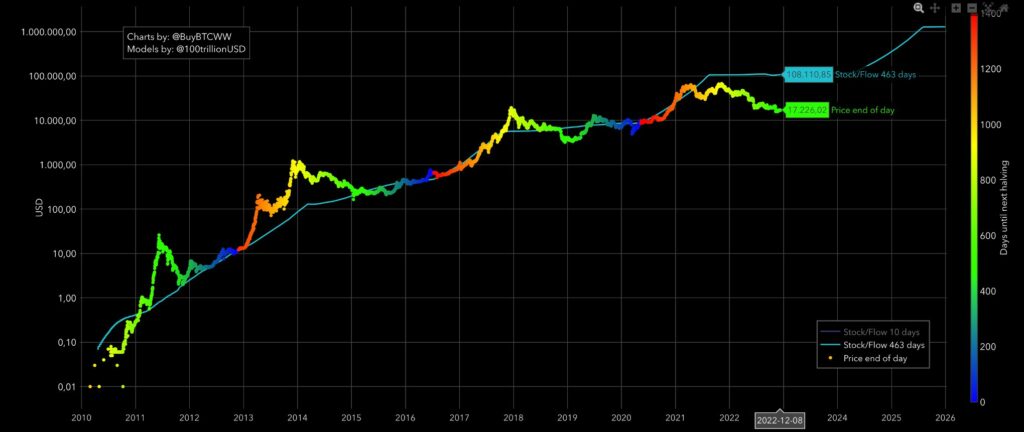
Is The Stock-to-Flow Model Still Relevant?
The stock-to-flow model (S2F) is used to assess the scarcity of asset classes and especially precious metals. The creator Plan B’s insight was to apply it to bitcoin. The stock-to-flow model calculates the quantitative ratio of production and units in circulation. Bitcoin is a particularly scarce asset because its supply is strictly limited to 21 million native units. Bitcoin’s supply is defined at the protocol level, making it easily predictable.
Although the price of bitcoin is currently well below the stock-to-flow model, similar divergences have occurred in the past. BTCUSD has fluctuated above and below S2F over the years: In the 2017 bull cycle, BTCUSD rose significantly above the stock-to-flow model. In the bear market of 2019, on the other hand, BTCUSD fell significantly lower than S2F. The price of bitcoin seems to find a correlation with S2F, even if the divergence sometimes takes years.
With the spot price of Bitcoin at $17K, the 463-day S2F shows a reading of $108K. Although the current divergence is considerable, PlanB sees it as part of the model’s operation. In his latest comments, PlanB sees bitcoin’s current valuation level as exceptionally low and urges investors to make an allocation before the market really starts pricing in the upcoming halving event.
What Are We Following Right Now?
Sam Bankman-Fried, the founder of FTX, has been arrested in the Bahamas. FTX was previously one of the world’s largest crypto exchanges, and it applied for chapter 11 corporate restructuring in November.
Almost an hour-and-a-half-long in-depth discussion about the status quo of the market and the outlook for 2023.

Doriani Vincileoni of the Kucoin exchange answers questions about the security of crypto exchanges.

Stay in the loop of the latest crypto events
- Ledger’s new cold wallet & Stripe entering into collaborations
- Technical Analysis: Oversold Bitcoin
- Crypto lender Genesis in trouble & Bitcoin still more valuable than many large corporations

The views, thoughts, and opinions expressed in the text belong to the author and not necessarily to the author’s employer, organization, committee, or other group or individual.