

The technical analysis of week 47 delves into recent technical indicators and blockchain data. We take a closer look at Chaikin Money Flow metric and why it indicates capitulation. In addition, we study the exchange’s proof of reserve data and evaluate its relevance.
Cautious Optimism
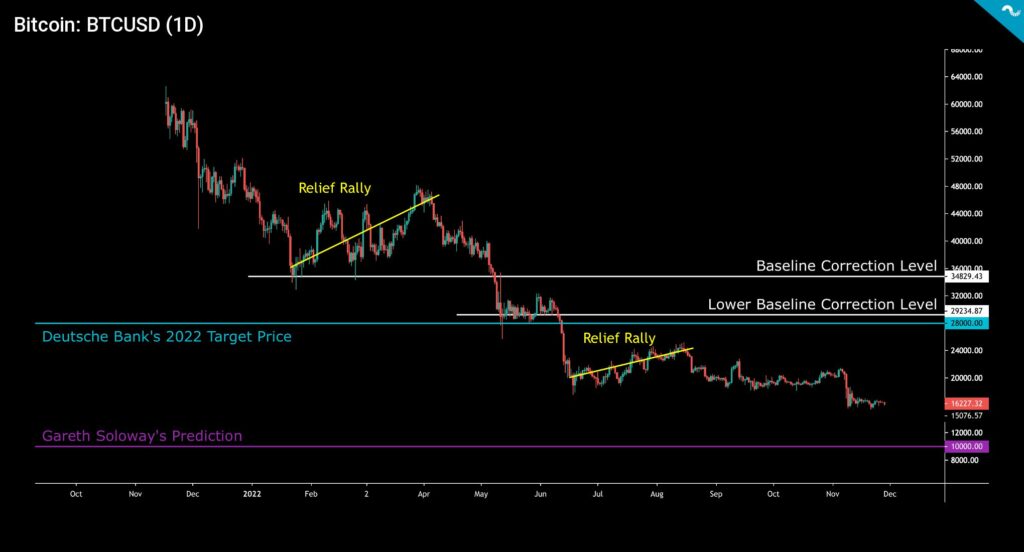
The digital asset market showed cautious optimism during week 47; however, the uncertainty generated by FTX / Alameda crisis is still heavily present. The spot price of bitcoin now appears to be heading towards Gareth Soloway’s $10 000 scenario (purple), which the analyst believes will be the final price bottom. Deutsche Bank previously set a target price of $28 000 (turquoise), which is unlikely to materialize. The current market situation has clearly driven away some of the risk-averse investors, but for long-term accumulators, the low price is a significant opportunity.
At the same time, there is clear optimism in the industry as the financial services corporation Fidelity enabled crypto transactions for its retail customers this week. We are about to see mergers and acquisitions among exchanges, and according to rumors, the Poloniex and Huobi are about to merge. The year 2023 can still be considered promising because the central bank Fed is expected to end its hawkish monetary policy, which would bring new momentum to high-beta asset classes.
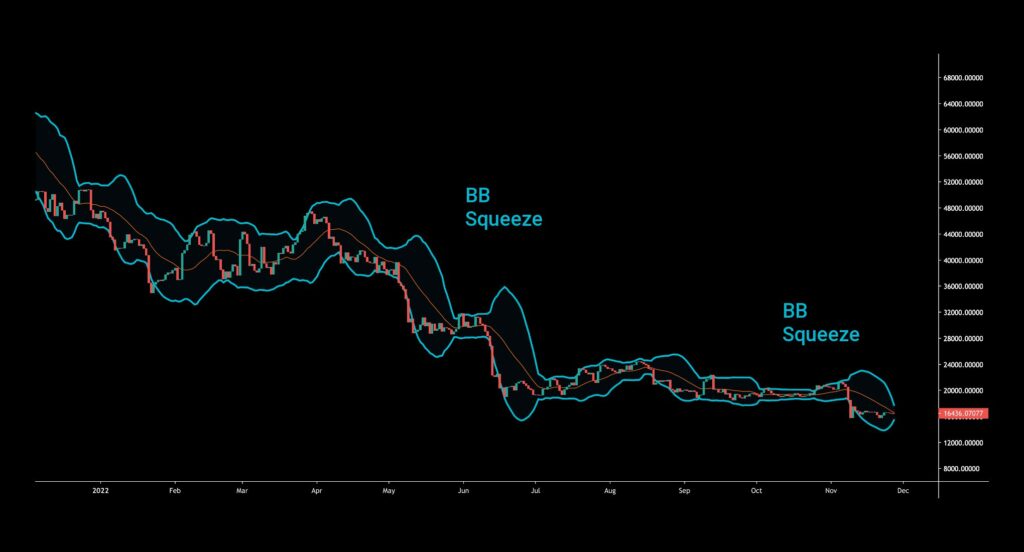
The technical Bollinger bands (turquoise) have guided bitcoin’s price development this year and are squeezing the spot price downwards again. At the same time, there are clear signs of capitulation in the market.
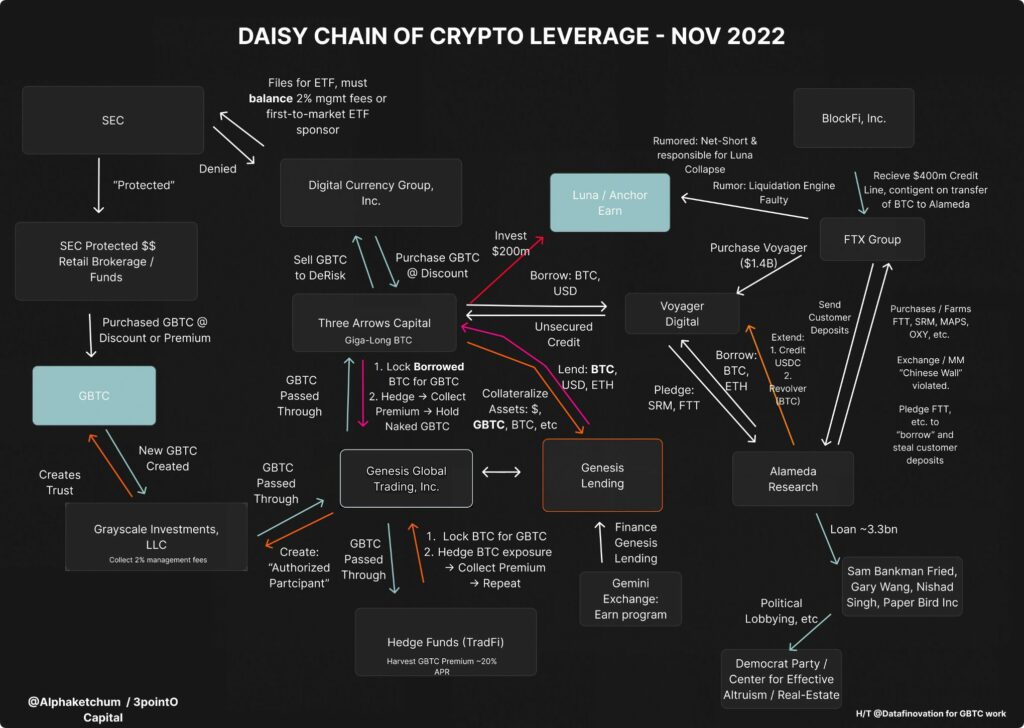
The following diagram illustrates the complex interdependence of crypto market players. One of the biggest challenges are the exchanges’ own unregulated tokens, such as the FTX exchange’s FTT, the use of which has not been closely monitored. A large part of the balance sheet of Alameda Research, the trading company of the FTX exchange, consisted of FTT assets that went through a rapid decline in value. The impact of Grayscale’s GBTC fund on the market has also been significant, as institutional investors used the fund’s high premium for arbitrage trading. According to Ryan Selkis’s latest assessment, Genesis, which belongs to the DCG group with Grayscale, is not headed for chapter 11 corporate restructuring.
The leading cryptocurrency, Bitcoin, has managed to strengthen by 4,3 percent after several weeks of weakness. In the case of Ethereum (9,4%) and Litecoin (25,1%), we can even talk about a relief rally. Decentralized finance token Chainlink has also performed excellently, rising 26,4 percent in a week. The performance of cryptos is currently diverging from the stock market, which has moved almost sideways (0,4%) in a week.
7-day Price Performance
Ethereum (ETH): 9,4%
Litecoin (LTC): 25,1%
Aave (AAVE): 10,4%
Chainlink (LINK): 26,4%
Uniswap (UNI): 5,8%
Stellar (XLM): 5,4%
XRP: 6,8%
S&P 500 Index: 0,4%
Gold: 0,06%
Chaikin Money Flow (CMF) Indicates Oversold Bitcoin
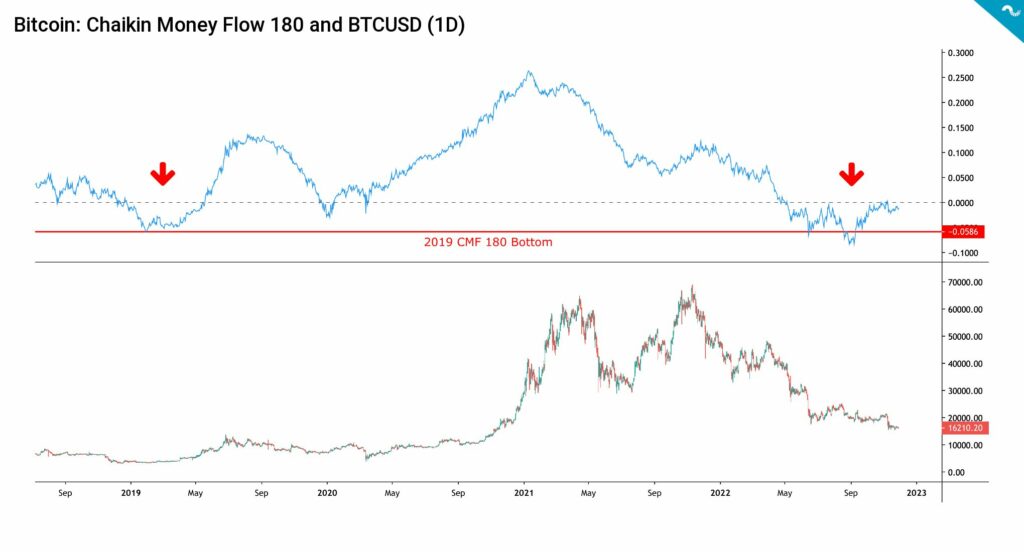
Bitcoin’s spot price has fallen -66 percent since the start of the year, leading to one of the deepest bear markets in the history of the asset class. In historical context, Bitcoin is definitely oversold, as illustrated by Chaikin Money Flow (CMF) indicator. The simplest way to interpret Chaikin Money Flow indicator is to divide the CMF data into values above and below zero. CMF values above zero (> 0) indicate market strength, and values below zero (< 0) indicate relative weakness.
In the bear market of 2019, the 180-day Chaikin Money Flow indicator reached its lowest value of -0,058, from where it rose above zero again during May. During the summer 2019 spot price rally, the CMF rose to a level of 0,14, reflecting a significant upturn in the market. Despite the uncertainty of spring, the CMF remained above zero in 2020, peaking at 0,26 in January 2021. The weak correlation of the 180-day CMF with the spot price in late 2021 was a clear indicator of market weakness, despite new price records.
In September 2022, Chaikin Money Flow reached a new low again, reaching a value of -0,08. This is the lowest CMF value since 2015 when the indicator fell to -0,16. In summary, Chaikin Money Flow reflects that bitcoin is in a heavily oversold market not seen since 2015.
Miner Capitulation Ahead?
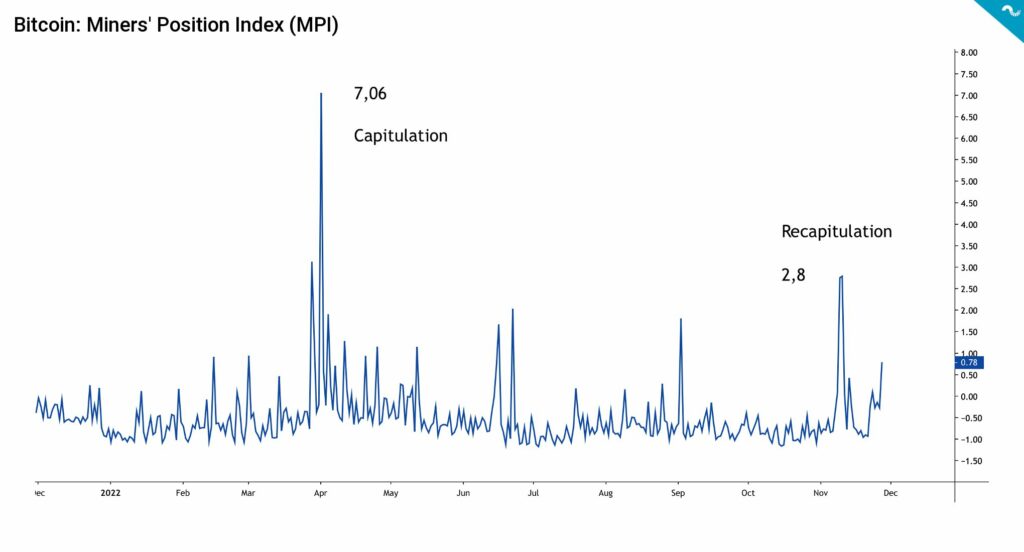
The capitulation of miners is usually the last sign of finding a market base. In the current market, inflation has increased the cost structure of professional miners, while rising interest rates increase borrowing costs. At the same time, the spot price of bitcoin is falling, and the difficulty level of mining is still high. Therefore, the equation is increasingly difficult for miners. The Miners Position Index (MPI) uses a 365-day moving average to interpret miners’ behavior with the following logic:
↑ High MPI: More selling pressure from miners. Bearish
↓ Low MPI: Less selling pressure from miners. Bullish
The Miners’ Position Index for this year is divided into two segments, capitulation and recapitulation. According to MPI, the capitulation of the first wave of miners took place in the spring. MPI rose to a peak of 7,06 for the year. The summer after the capitulation in the spring was better, but in the autumn, the MPI has risen again to the level of 2,8, which is the highest value since April. Thus the Miners’ Position Index mirrors the miners’ final capitulation during the last quarter of 2022.
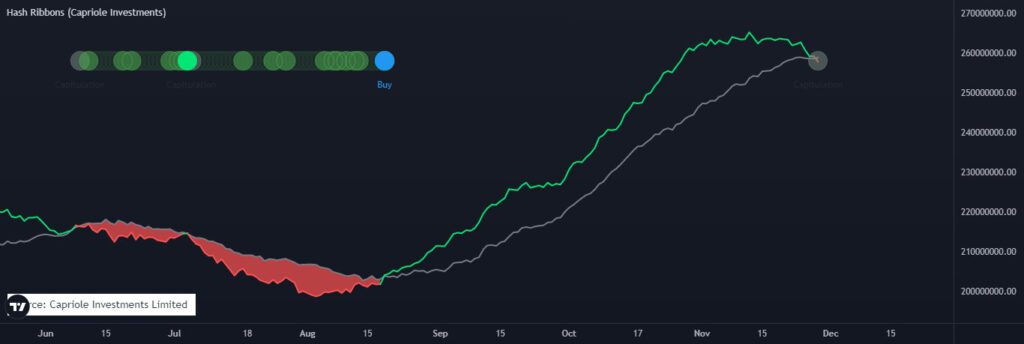
Another indicators depicting the capitulation of miners are the “hash ribbons” that are about to meet in early December (chart below). The convergence of hash ribbons has historically meant finding a market base.
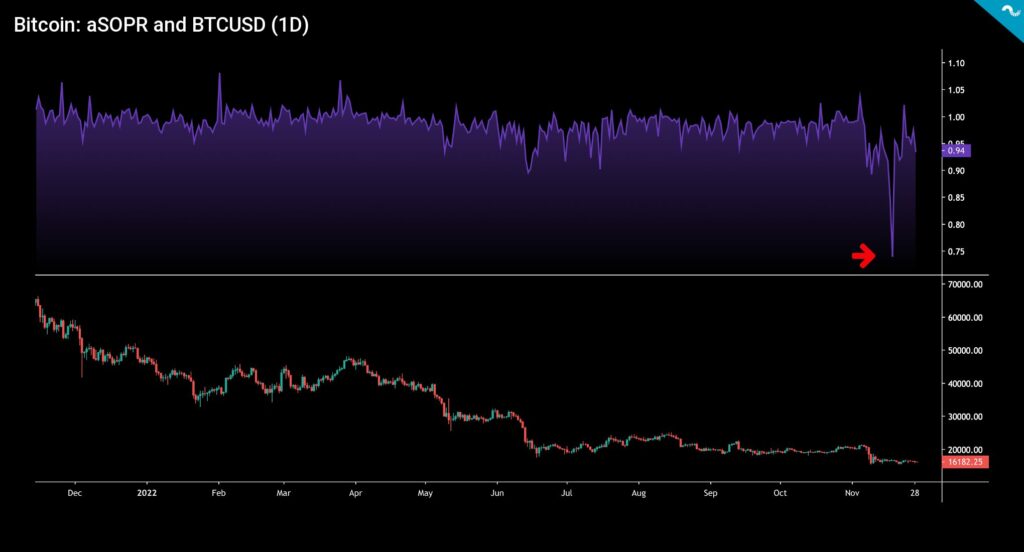
aSOPR Indicates an Approaching Market Bottom
Adjusted Output Profit Ratio, or aSOPR, describes how many investors are now selling their bitcoins at a loss. aSOPR fell to 0,74 in November, which is also the lowest reading for the entire year. The metric describes how especially recent bitcoin investors have panicked as a result of the FTX crisis and are ready to sell their holdings at a considerable loss. It is still good to remember that overall only 30 percent of UTXO outputs are at loss, and 70% are still profitable. The profitability of Bitcoin investments is emphasized with a long time horizon, and “holders” traditionally are more profitable than traders with a narrow time window.
Proof of Reserves Trying to Enhance Exchange Transparency
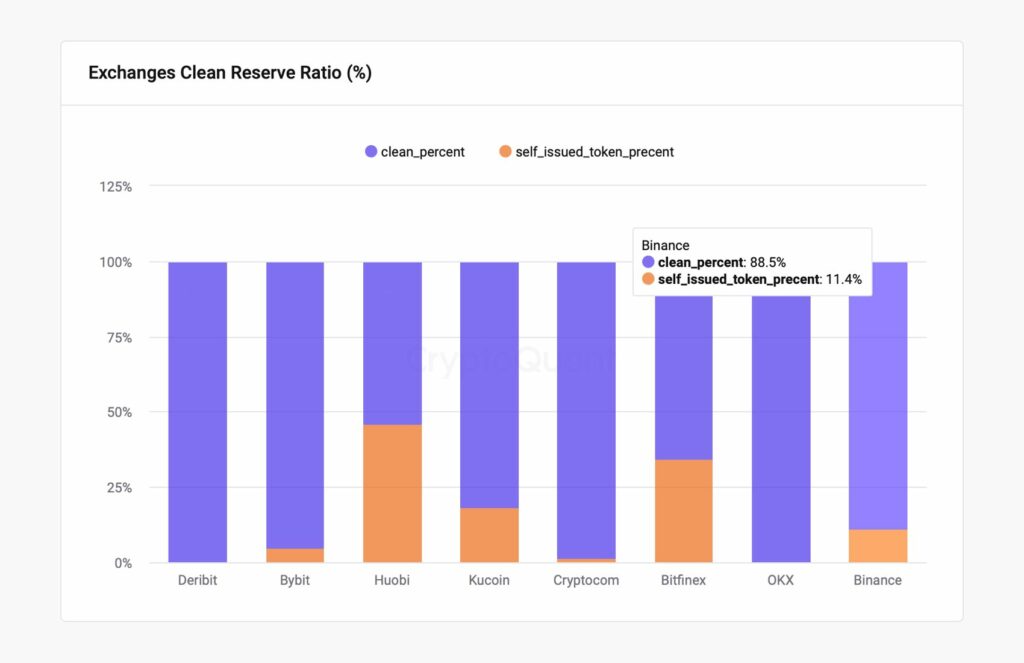
CryptoQuant has started to publish exchange proof of reserves, which open the balance sheets of the largest industry-related companies. The diagram below shows how 88,5 percent of the reserves on the Binance exchange are “clean” and only 11,4% of the reserves consist of the company’s own BNB tokens. According to the data, the reserves of the exchanges Bybit, Crypto.com, Deribit, and OKX consist entirely or almost entirely of clean tokens.
The situation of the Bitfinex and Huobi exchanges seems more worrying because a significant part of their reserves consists of their own native tokens. In the case of Bitfinex, the share of native tokens in the reserves is 34,2 percent, and in the case of Huobi, a whopping 46,2%. In particular, the Huobi exchange has therefore been exposed to a decline in the value of its own native tokens, which in the worst-case scenario, could lead to the company’s insolvency. For context, Huobi is currently planning a merger with the Poloniex exchange. The ex-CEO of the Kraken exchange, Jesse Powell, recently took a stand on reserve certificates and criticized the data provided by Binance. According to Powell, declaring reserves is useless if transparent data about the company’s liabilities is not provided at the same time.
What Are We Following Right Now?
Scott Freeman, founder, and partner of JST Capital, a 100% digital asset-focused financial services firm, opens up about the rise and fall of the FTX crypto empire and Alameda Research. Freeman evaluates the crypto market through three variables, which are: liquidity, leverage, and volatility. Liquidity decreases after major market events, so liquidity is weak and may even deteriorate in the short term. However, Freeman argues that volatility may decrease as the system is deleveraged.

Lawyer and venture capitalist Jeppe Stokholm ponders the possible criminal consequences after the collapse of FTX. He also discusses crypto regulation, the battle between decentralized and centralized technical solutions, and the NFT market.

Stay in the loop of the latest crypto events
- Crypto lender Genesis in trouble & Bitcoin still more valuable than many large corporations
- Web3 in Slush & El Salvador continues BTC purchases
- Technical Analysis: Capitulation and Market Bottom?
- FTX goes bankrupt – The crypto market still holds its ground

The views, thoughts, and opinions expressed in the text belong to the author and not necessarily to the author’s employer, organization, committee, or other group or individual.