


The technical analysis of week 28 charts the market’s technical development and the impact of regulation on it. Additionally, we delve into the price rally of Stellar and XRP, as well as profitability thresholds for different investor groups. We also explore the latest price projections for bitcoin.
The cryptocurrency market’s price development has mainly continued sideways since last week, with the leading cryptocurrency bitcoin weakening by approximately one percent. The second-largest cryptocurrency by market capitalization, Ethereum, continues to closely correlate with its bigger brother.
As bitcoin’s momentum remains relatively weak, there is a clear divergence with XRP and Stellar charting their own course. Within the last 30 days, XRP has strengthened by 70,1 percent and Stellar by a significant 118,2 percent. Both growth spurts are attributed to regulation, with XRP being included in the SEC’s commodity classification list. There are also speculations about Stellar receiving a similar commodity classification, although there is no certainty about the decision yet.
Charles Edwards commented on bitcoin’s outlook in his recent market overview, mentioning that the wave of positive news has brought a new kind of strength to the market. Investors are now waiting for a signal regarding the future direction of the cryptocurrency, which is trading around the $30 000 confluence zone. According to Edwards, the market setup resembles the fourth quarter (Q4) of 2016.
“Despite trading at $30K, Bitcoin has the same relative value opportunity today as at Q4 2016. Price continues to trade below global average production cost at $36K; the byproduct of an incredible expansion in the network’s growth. Long-term value.” – Charles Edwards, Capriole Investments
From a purely technical perspective, bitcoin remains within its ascending channel (white), continuing its sideways movement for the fifth week. At the same time, bitcoin’s active addresses triple-bottom pattern indicates an upward direction for the spot price. Bitcoin is firmly in the accumulation phase (turquoise) leading up to its 2024 spring halving event. The spot price receives support from the 200-day moving average and the underlying realized price wave.
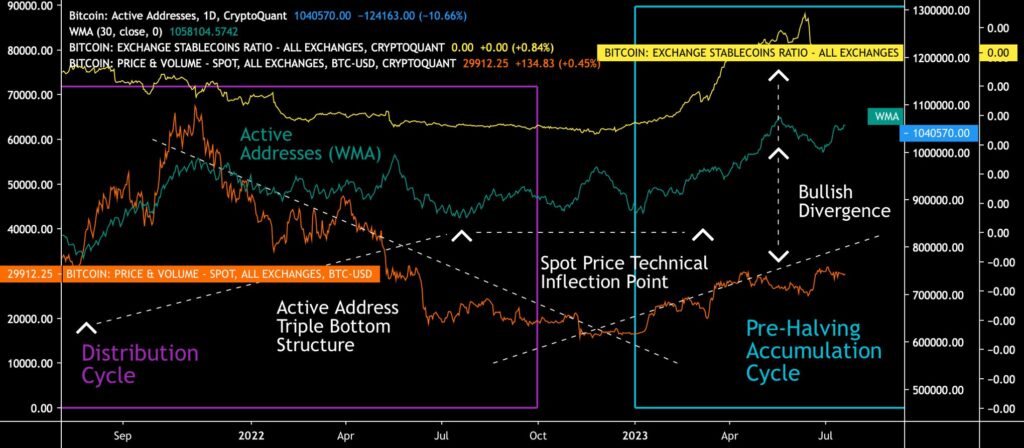
Sources: Timo Oinonen, CryptoQuant
There are indications of institutional demand renaissance, with companies like BlackRock, a prominent asset manager, aiming to launch an ETF fund. Meanwhile, the leading Bitcoin company, MicroStrategy (MSTR), has continued its accumulation this year (red), purchasing a total of 19 883 units since the beginning of the year.
The 212 percent surge of MicroStrategy this year has been considered an indicator of institutional appetite, and the early-year purchases may be seen as a sign of broader market recovery. Entities like MicroStrategy are among the first to increase their exposure to Bitcoin following a market inflection point.
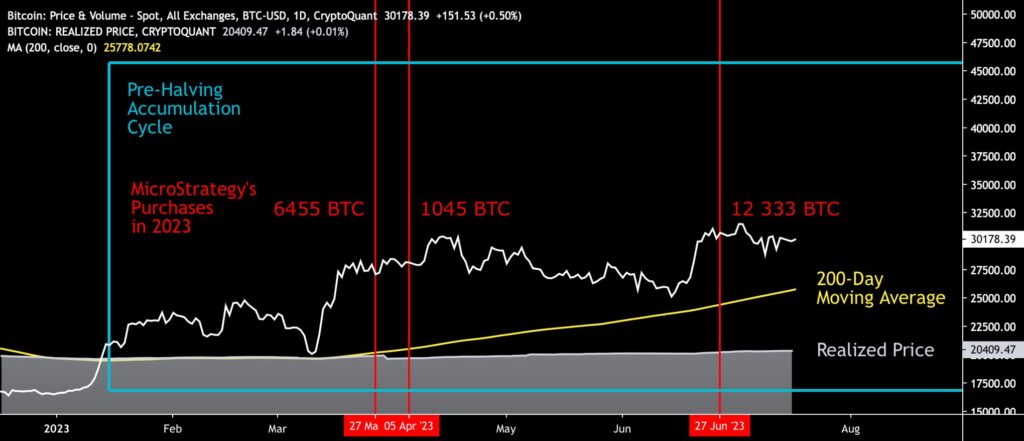
Sources: Timo Oinonen, CryptoQuant
Material Indicators’ heat map indicates that bitcoin’s demand has diminished this week. The levels of $31 000 and $32 000 remain significant target levels. The Cumulative Volume Delta (CVD) reflects the importance of whale level buy orders for the market.
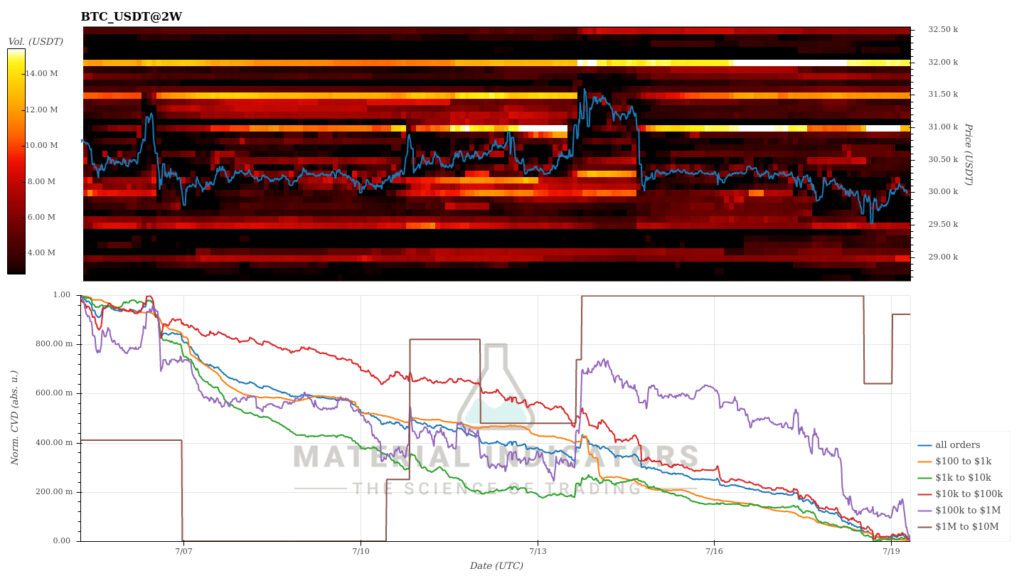
Source: Material Indicators
As bitcoin and Ethereum trade sideways, many high-beta tokens are diverging from their performance. Chainlink strengthened by 27,9 percent in the past week, while XRP and Stellar have surged over 70 percent. The rise in XRP is attributed to the SEC’s decision to exclude it from the securities category. Stellar’s ascent, on the other hand, is supported by speculation about its inclusion in the commodity tranche similar to XRP. Litecoin, which is set to undergo its halving event in 12 days, has experienced a slight disappointment in its price development, declining by 6,4 percent. Meanwhile, the S&P 500 stock index strengthened by over 2 percent during the week.
Seven Day Price Performance
Stellar Uplifted by Classification Speculations
Year-to-date (YTD) performances recorded since the beginning of the year provide a clearer picture of the market at the weekly level. Despite bitcoin’s impressive 82,87% YTD growth, both XRP and Stellar have surpassed it in July. XRP has now strengthened by 138,81% since the beginning of the year, while Stellar has grown by 125,18%. Other Coinmotion-related cryptocurrencies have performed significantly weaker than bitcoin.
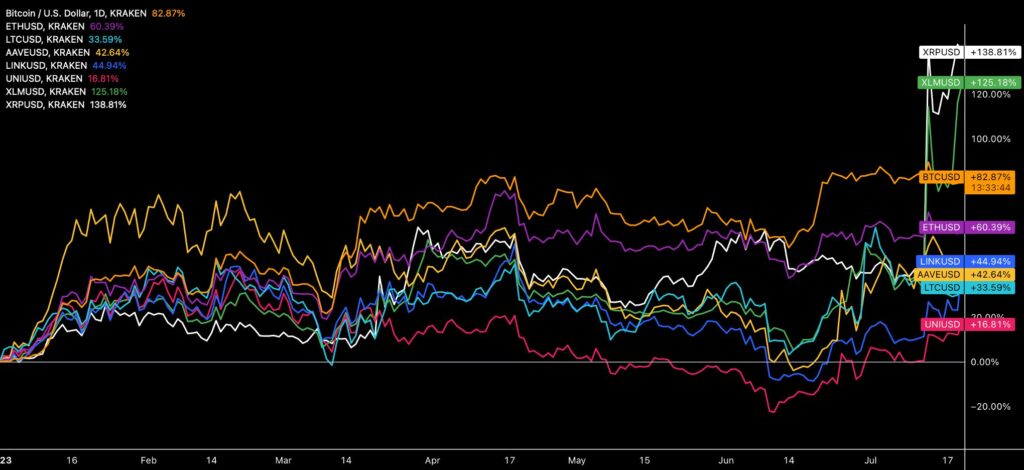
Source: TradingView
The divergence created by the U.S. Securities and Exchange Commission (SEC) continues to shape the cryptocurrency market. At the beginning of June, the commission divided cryptocurrencies and tokens into two main categories: “commodity tokens” and “securities tokens.” Initially, this radical classification only included Bitcoin and Ethereum in the commodity group, ensuring their positions. Now, XRP has also been included in the commodity token category.
Commodity tokens have seen a 9% increase since the fourth day of June, while securities tokens have declined by -15%. Stellar’s 125% surge is largely based on speculation regarding its potential classification as a commodity token, which would strengthen its position compared to many other tokens.
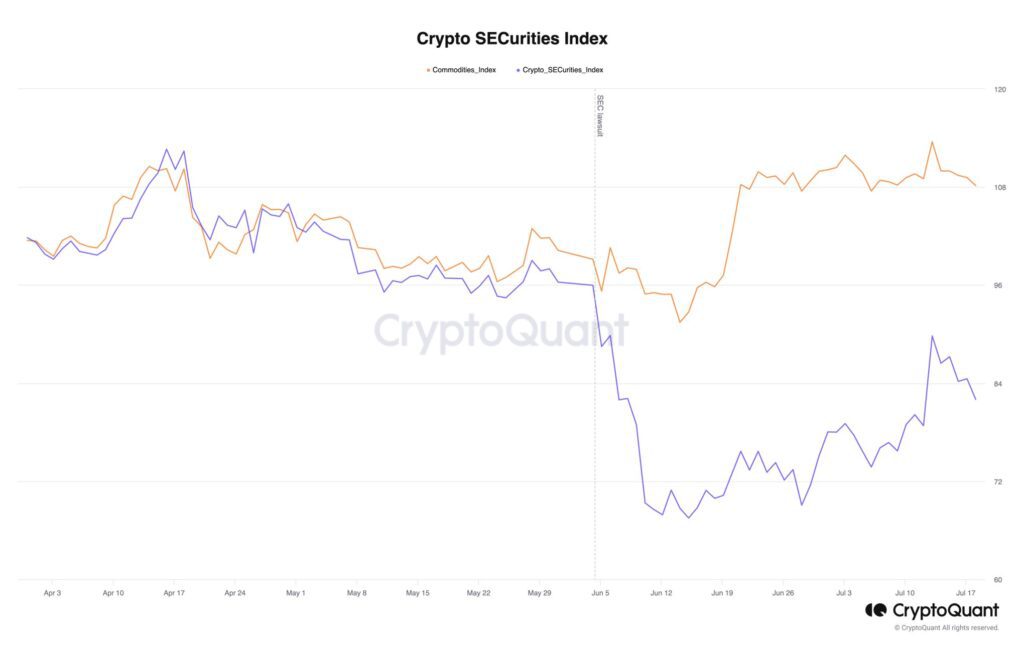
Source: CryptoQuant
At least the following cryptocurrencies are classified as security tokens: sol, ada, matic, fil, sand, axs, chz, icp, near, vgx, dash, flow, mana, algo, nexo, atom, bnb, busd, and coti.
The Capriole Macro Index Indicates a New Recovery Phase.
Despite bitcoin’s spot price sideways movement, many experts still view the market fundamentals as strong. Capriole Investments’ macro index depicts bitcoin in a recovery phase (green), suggesting that the cryptocurrency is currently undervalued. According to the macro index, bitcoin’s current market structure resembles that of 2019, when the cryptocurrency transitioned from a recession phase (red) to an expansion phase (dark green).
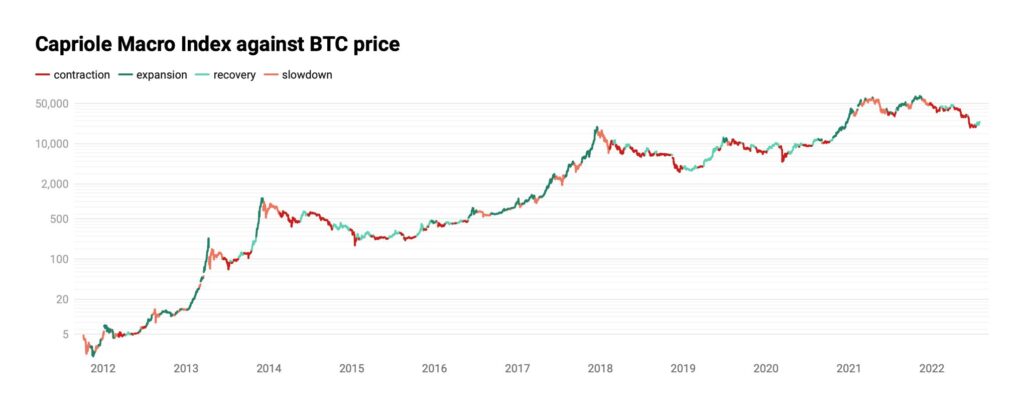
Source: Capriole Investments
The macro index was developed by Capriole Investments, a wealth management firm registered in the British Virgin Islands, with its clientele consisting of HNWI (High Net Worth Individuals). Capriole has recently increased its profile, particularly in the field of on-chain market research.
SOPR Reflects Decreasing Volatility
The short-term investor break-even, represented by the STH-SOPR indicator (yellow), and the long-term investor break-even, represented by the LTH-SOPR indicator (turquoise), are now approaching each other, indicating a calming of the volatility storm. This year, short-term investors have been below the red profitability threshold (1) for an extended period due to the weakness in spot prices.
The approaching of the short-term investors’ profitability threshold (1,01) may also reduce selling pressure in this group since selling below 1 would result in losses. Historically, long-term investors (or holders) have outperformed their short-term counterparts.
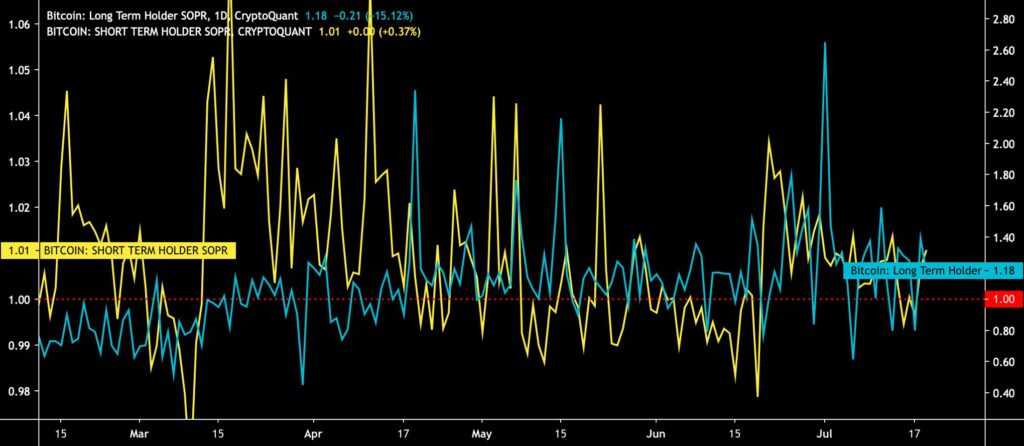
Sources: Timo Oinonen, CryptoQuant
Developed by Renato Shirakashi, the SOPR indicator is calculated by dividing the realized price of bitcoin (USD) by the value of the original bitcoin transaction. Or, in simplified terms, the selling price divided by the purchase price. SOPR indicates whether the average bitcoin investor is in profit or at a loss. The SOPR indicator is usually divided into two parts: Short-term holders (STH-SOPR) and long-term holders (LTH-SOPR). The SOPR indicator can be interpreted with the following logic:
SOPR > 1 = Seller in profit
SOPR < 1 = Seller at a loss
Can an ETF Uplift Bitcoin to 50 000 Euros
In the technical analyses of the spring, we assessed that bitcoin could rise up to $46 092 in the year 2023. The target price has not been realized yet, but it remains possible as BlackRock’s ETF project progresses. Blofin recently published a comprehensive market overview, including bitcoin price projections under different scenarios.
Blofin sees changes in interest rates as a determining factor in the market, with lower interest rates benefiting high-beta asset classes such as bitcoin. With interest rates ranging between 5,25% and 5,75%, Blofin envisions bitcoin’s price oscillating between $30 880 and $36 026. A more favorable scenario is represented by the approval of the ETF, which correlates with a rising bitcoin dominance. In Blofin’s most favorable scenario, if the Fed lowers its interest rates while liquidity returns to the crypto market, the target price for Bitcoin increases to $52 500.
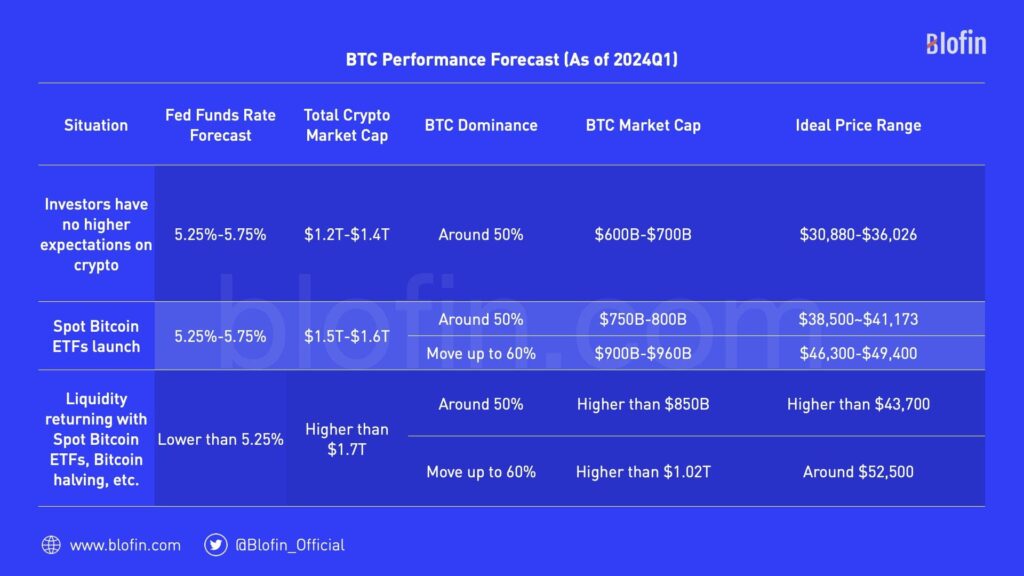
Source: Blofin
What Are We Following Right Now?
According to Josh Frankin, BlackRock may attract new investments worth hundreds of billions of dollars.

Is the crypto summer finally here? Mark Yusko is analyzing the state and prospects of the market.

Preston Pysh and Matt Odell are discussing Bitcoin, freedom, and the potential redistribution of wealth.
