

The TA of week 29 focuses on the market’s weekly events and potential development directions. At the same time, we examine why XRP has been the most traded altcoin in 2023. Additionally, we explore bitcoin’s price projection after the possible ETF launch.
The sentiment of the cryptocurrency market is mildly bearish following the six weeks of sideways movement. The leading cryptocurrency bitcoin has weakened by 2,7% compared to the previous week, with Ethereum closely correlating with its movement. XRP and Stellar, which had gained momentum during last week’s regulatory rally, have lost some of their steam, bringing their year-to-date performance closer to bitcoin.
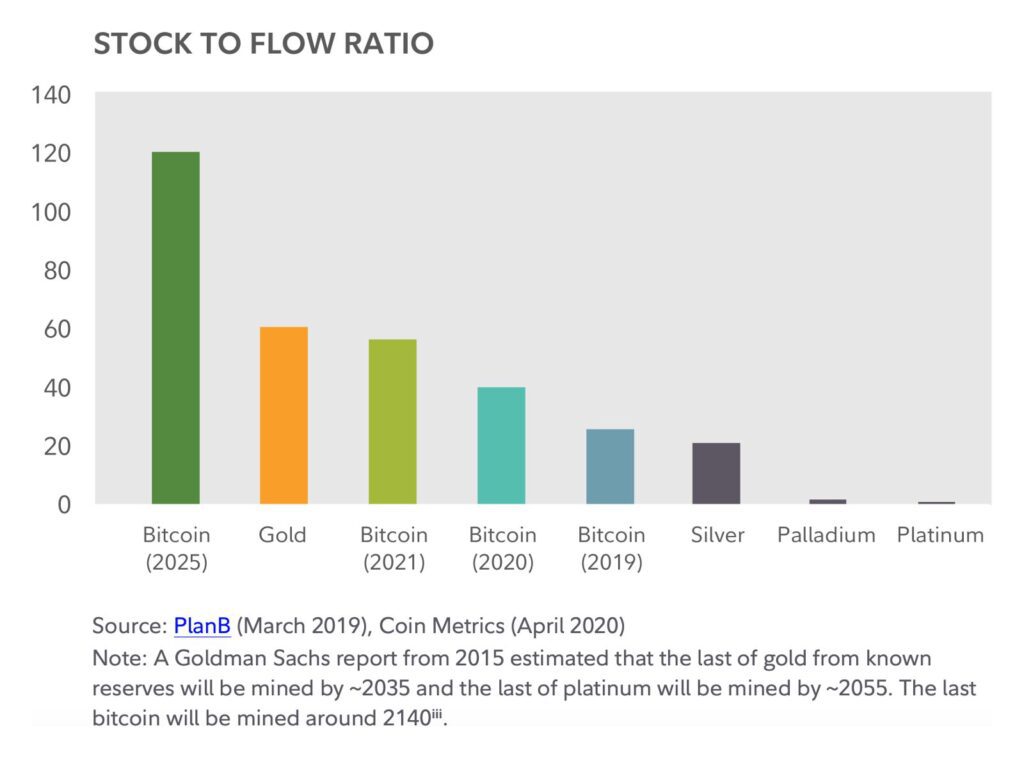
In a recent report, Fidelity Digital Assets presents investment theses for Bitcoin, touching upon the growth of institutional demand. Fidelity also comments on Bitcoin’s scarcity properties, referring to the stock-to-flow model (S2F). According to Fidelity, Bitcoin’s S2F ratio is now slightly below that of physical gold but is expected to surpass gold by 2025. The company sees the dawn of institutional interest in the form of funds like Tudor BVI.
“Tudor Investment Corporation’s decision to allocate to bitcoin in the Tudor BVI fund is evidence that unprecedented levels of monetary growth are driving institutional interest in bitcoin’s store of value properties.” – Fidelity Digital Assets
From a purely technical standpoint, bitcoin has been oscillating within its sideways channel (blue) for six weeks, as investors await a clear signal regarding the market’s future direction. With a 76% price increase since the beginning of the year, bitcoin’s performance is commendable, with the current price standing at $44 411.
The rising channel (white) for bitcoin is supported by the 200-day moving average (yellow) and the realized price wave below it (violet). Whales’ activity on exchanges (turquoise) is on a declining trend, correlating with the decreasing volatility.
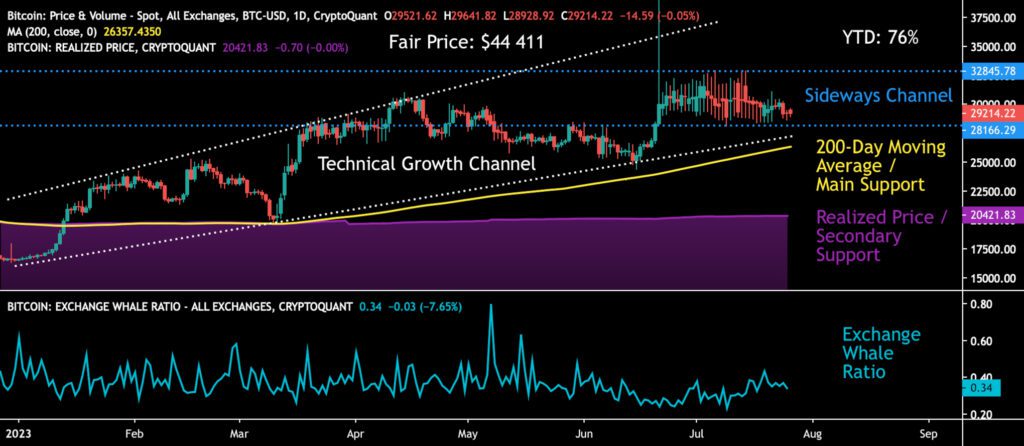
Sources: Timo Oinonen, CryptoQuant
Bollinger Bands (violet) are at their tightest since May, indicating significant compression in the spot price. The current level of $30 000 is a multi-year confluence area for bitcoin.

Sources: Timo Oinonen, CryptoQuant
Material Indicators’ heat map indicates two significant resistance levels above the spot price at $31 000 and $32 000. Although bitcoin briefly broke the $31 000 resistance in mid-July, revisiting those levels would require a new flow of demand.
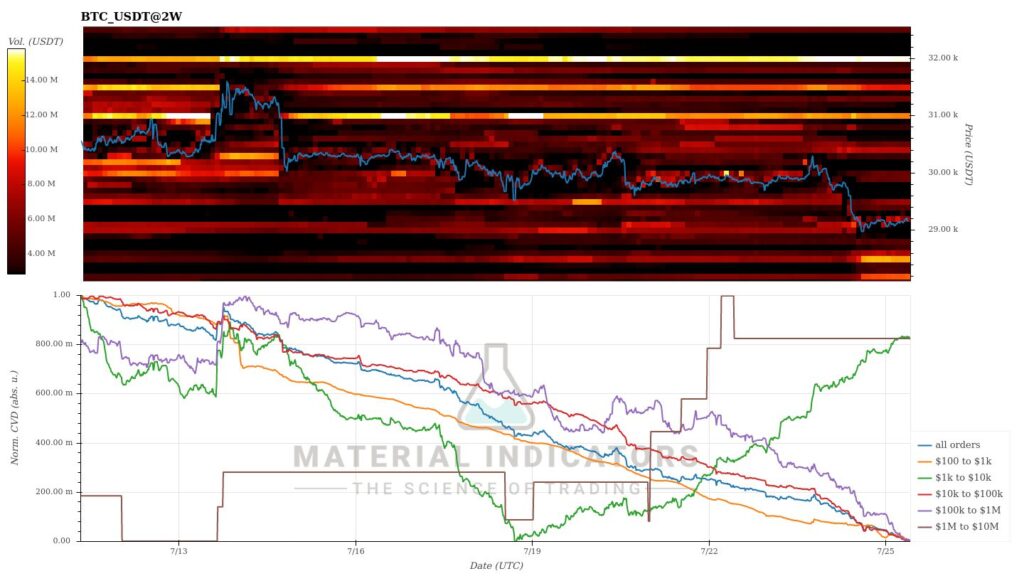
Source: Material Indicators
In his weekly report, James Butterfill comments on the CoinShares inflows. Butterfill points out that after a month of positive momentum, the flows have recently turned negative. Meanwhile, Ethereum is challenging bitcoin’s popularity in the institutional field, with inflows of ETH reaching $6,6 million last week.
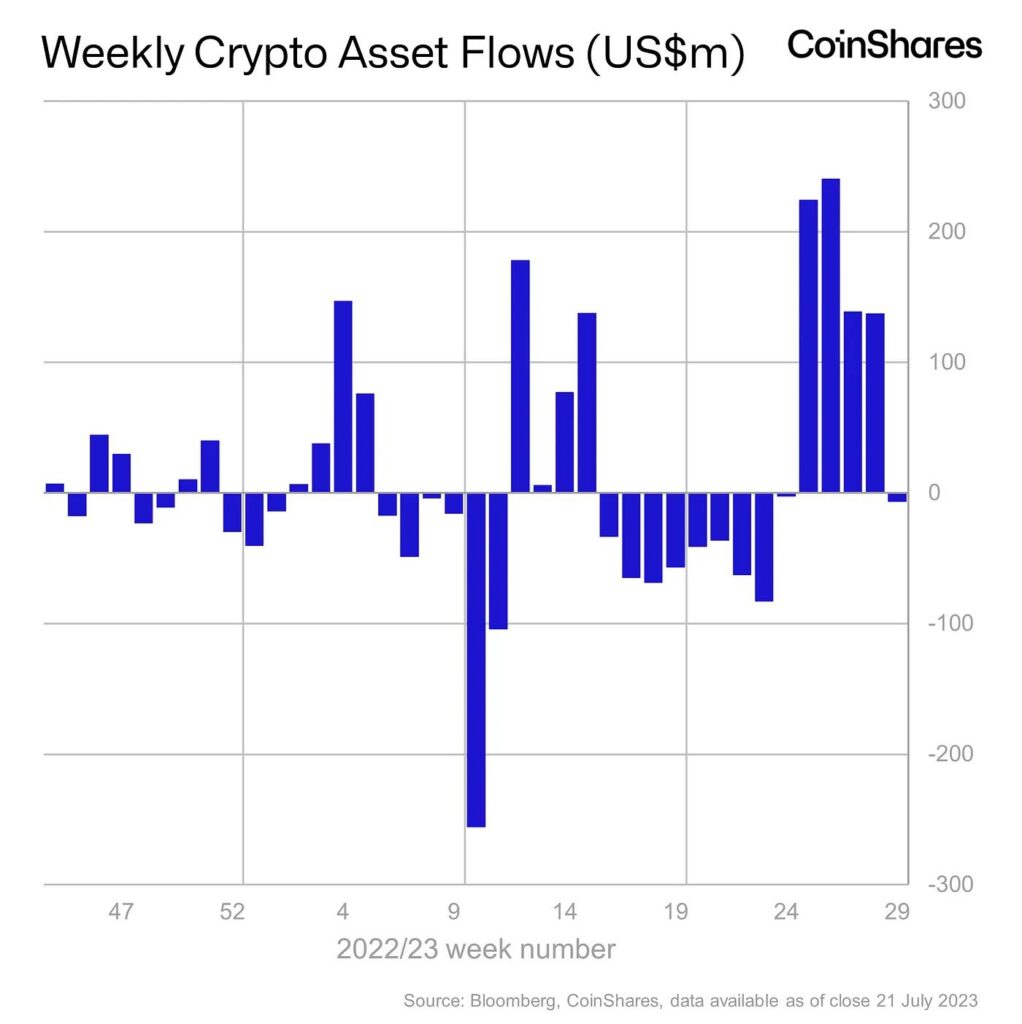
Source: CoinShares
The cryptocurrency market’s price development has continued to be moderately bearish, with bitcoin weakening by approximately 1% within the week. Ethereum, which closely correlates with bitcoin, also experienced a decline of -0,6%. Among tokens with higher beta, there haven’t been any significant breakouts, as their price movements remained within a few percentage points.
XRP, which emerged victorious in its legal battle against the SEC, weakened by -7,9% compared to the previous week. However, it still maintains its position at the top of the year-to-date performance list among tokens listed on Coinmotion.
Seven Day Price Performance
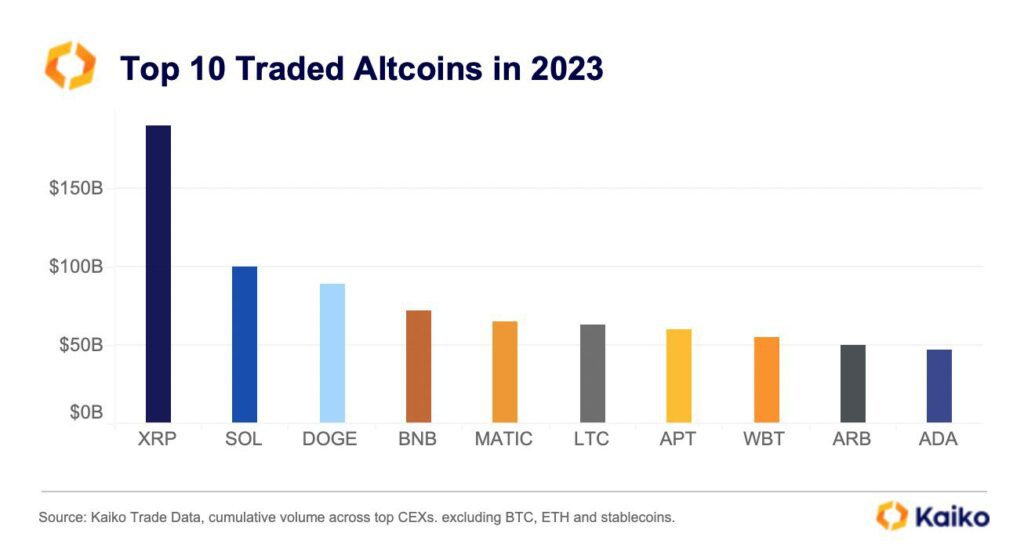
XRP Has Been the Most Traded Altcoins of 2023
According to Kaiko’s data, XRP, available on the Coinmotion platform, has been the most traded altcoin this year, with its cumulative volume reaching nearly $200 billion. Surprisingly, Solana secured the second-largest volume with $100 billion in trading volume. Elon Musk’s favored meme coin, Dogecoin, ranked third in terms of volume, approaching the $100 billion milestone.
The popularity of XRP can be attributed to favorable regulatory developments, as Ripple Labs won its legal battle against the U.S. Securities and Exchange Commission (SEC). The commission determined that XRP should be classified as a commodity rather than a security. This case has propelled XRP’s strong upward momentum.
Source: Kaiko
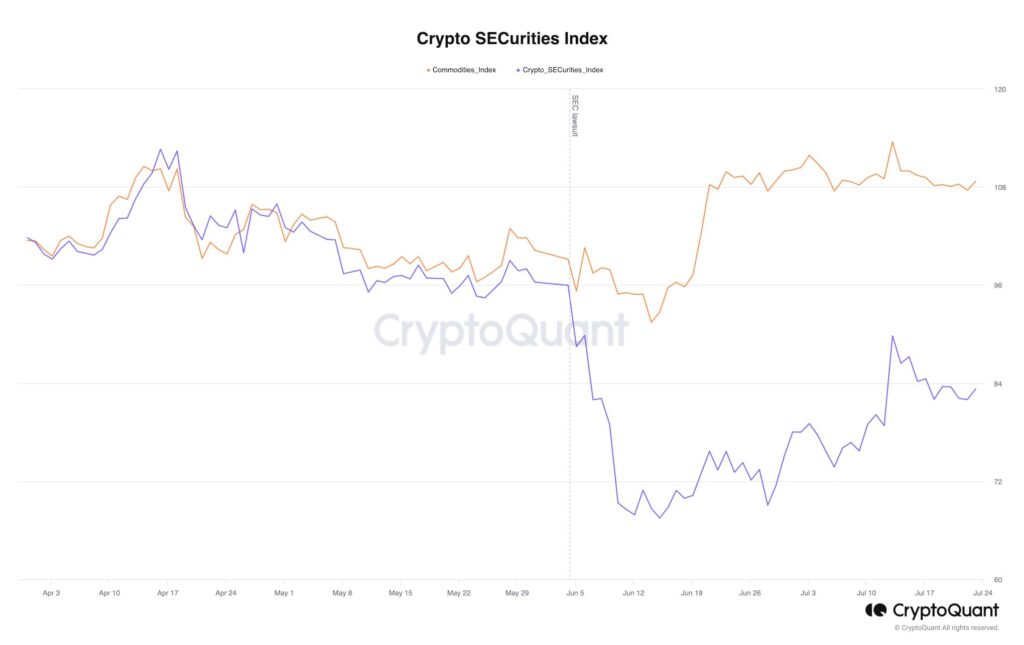
As of early June, the segmentation created by the SEC continues to serve as a watershed for the cryptocurrency market. The commission divided cryptocurrencies and tokens into two main groups: “commodity tokens” and “securities tokens.” Originally, only bitcoin and Ethereum were classified as commodity tokens, securing their positions.
Now, XRP is also included among the commodity tokens. Last week, there were speculations about Stellar possibly being classified as a commodity token, which escalated demand. However, as of now, the SEC has not announced its stance on Stellar. The regulatory landscape remains uncertain, and market participants closely monitor the commission’s decisions and announcements to understand the classification of different cryptocurrencies and tokens.
Source: CryptoQuant
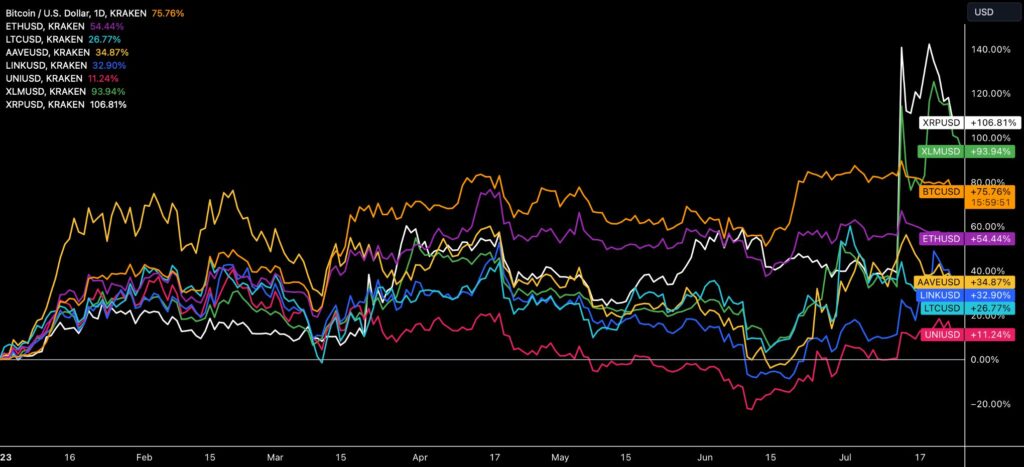
XRP continues to lead the year-to-date price performance among cryptocurrencies listed on Coinmotion, strengthening by 107% since the beginning of the year. The second-strongest performer is Stellar, which has risen by 94%. The leading cryptocurrency bitcoin divides the market, amplifying the divergence between assets like XRP and Uniswap.
Source: TradingView
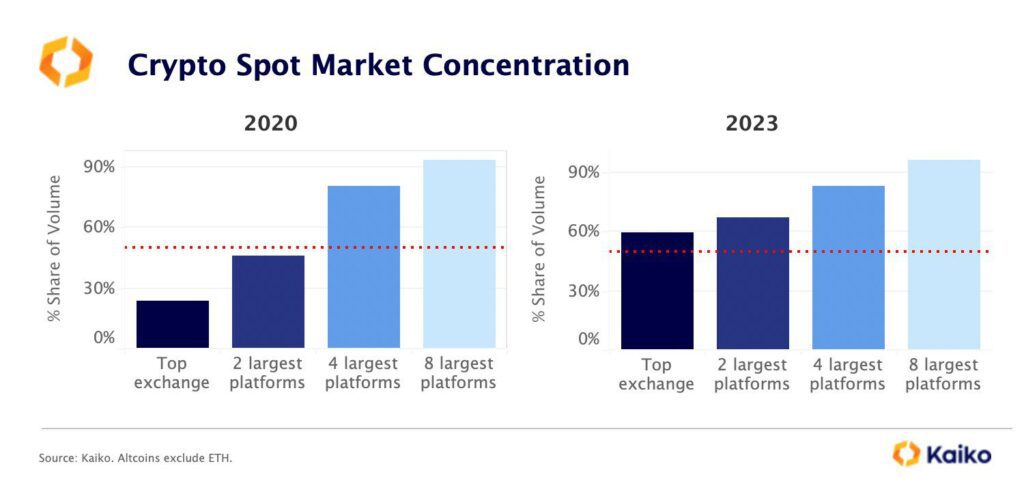
Is the Crypto Market Too Centralized
The centralized structure of the cryptocurrency market has been a topic of discussion since the turn of the year, with Binance’s spot market share rising above 90%. The continued dominance of Binance is seen as problematic because it makes the exchange the largest potential single point of failure in the industry.
According to data collected by Kaiko, the market is now significantly more concentrated compared to 2020. Three years ago, the market share of the largest exchange was only 24%, and the combined market share of the two largest exchanges was less than 50%. This year, Binance’s volume-based market share has stabilized around 60%.
Source: Kaiko
It seems like the US-based Binance.US exchange’s market share is diminishing significantly due to the regulatory actions taken by the U.S. Securities and Exchange Commission (SEC). The SEC’s regulatory clampdown has impacted both Binance and Coinbase, causing them to lose market share in all cryptocurrencies. As a result, alternative exchanges have been gaining ground, increasing their market share from 26% in January to 44% in July.
Is Bitcoin Following the Structure of the Year 2020?
As the market moves sideways, investors are now awaiting a clear signal for the future direction. In the bigger picture, the Bitcoin market can be better understood by dividing it into distribution (violet) and accumulation phases (turquoise), forming a continuum of market cycles. Institutional (smart) money has traditionally preferred accumulation cycles, while distribution cycles have been associated with retail investors.
The transition from an accumulation cycle to a distribution cycle can be tracked by the percentage of transaction fees in the block reward (yellow), which tends to rise before each distribution cycle. This indicator has accurately predicted changes in market cycles in 2019 and 2020. Before the 2019 halving, in the preceding accumulation cycle, the fees-to-reward metric rose to 0,12 before the summer relief rally. In 2020, the percentage of transaction fees in the block reward increased again, reaching 0,21 in May and later peaking at 0,29 in November.
The latest blockchain data shows that the percentage of transaction fees in the block reward is once again on the rise, and the spike resulting from the ordinals launch even surpassed the peak of 2021. The market structure continues to predict a continuous uptrend for the spot price, aiming for bitcoin’s “fair price” of $44 411.
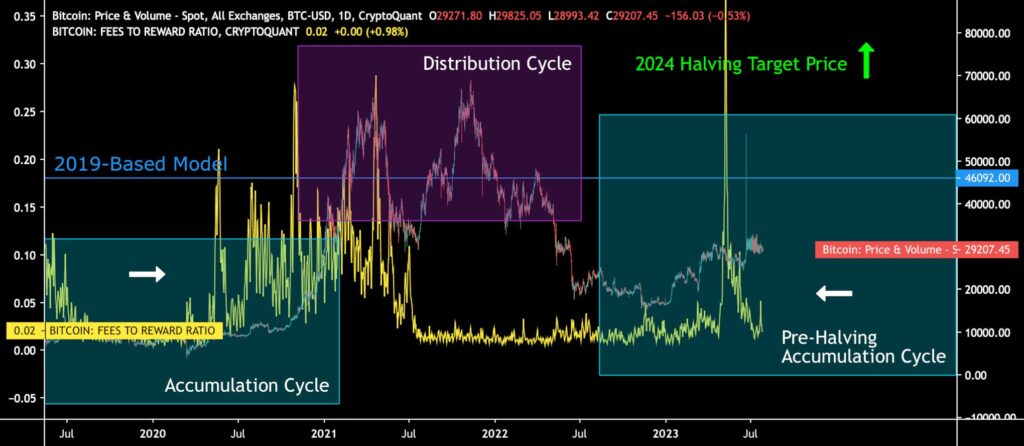
Sources: Timo Oinonen, CryptoQuant
How Much Can the ETF Listing Uplift Bitcoin’s Price?
There are high expectations surrounding the potential launch of a BlackRock’s ETF, and it can be seen as a defining factor in the market before the spring 2024 halving event. Investors are contemplating how high Bitcoin can rise with the introduction of an ETF.
Given that gold’s scarcity properties are similar to Bitcoin’s, the GOLD ETF fund can serve as a reference for a Bitcoin ETF. The GOLD ETF was launched in 2004 when gold was in a deep -50% bear cycle. Over the next seven years, the ETF fund saw a 350% increase in gold’s value. When bitcoin’s spot price is currently at $29 214, a 350% growth would raise it to $131 463.
According to the stock-to-flow model, Bitcoin’s scarcity will surpass that of gold by the year 2025, making Bitcoin an extremely scarce asset class. This adds to the anticipation and speculation surrounding its potential future value.
Source: Fidelity Digital Assets
What Are We Following Right Now?
Balaji Srinivasan’s theses about the future of the cryptocurrency market, sovereignty, and decentralization.

Lyn Alden’s and MacroVoices team’s comprehensive market outlook delves into various topics, including inflation, stock market, commodities, and gold.

Is Bitcoin a superior store of value asset?
