

The technical analysis of week 27 interprets the market using the latest technical and fundamental indicators. Additionally, it delves into the correlation between bitcoin and altcoins while assessing the role of MicroStrategy as a leading indicator of the market.
The price action of the cryptocurrency market has mostly moved sideways since last week, with the leading cryptocurrency bitcoin weakening by about one percent. Bitcoin continues to oscillate around the multi-year level of $30 000 as investors await a stronger signal regarding the direction of the market.
Recently, the market has clearly hinted at a renaissance of institutional interest, with asset management company BlackRock steadfastly progressing with the approval process for its ETF. ARK Invest, a company focused on disruptive technology, expressed promising views in its June report:
“Of the 19,4 million bitcoin in circulation, nearly 70% has not moved in at least one year or more, confirming a strengthening holder base. Both in relative and absolute terms, the quantity of bitcoin held for one year or more has reached an all-time high.” – ARK Invest
From a purely technical perspective, bitcoin has been trading within its sideways channel (yellow) for the past four weeks, following a V-shaped correction (orange). Bitcoin dropped from its parabolic advance and several ascending channels (blue, pink) in the early spring, but it recovered noticeably in mid-June. Bitcoin is currently supported by the 200-day moving average (turquoise) and the wave of realized price (gray).
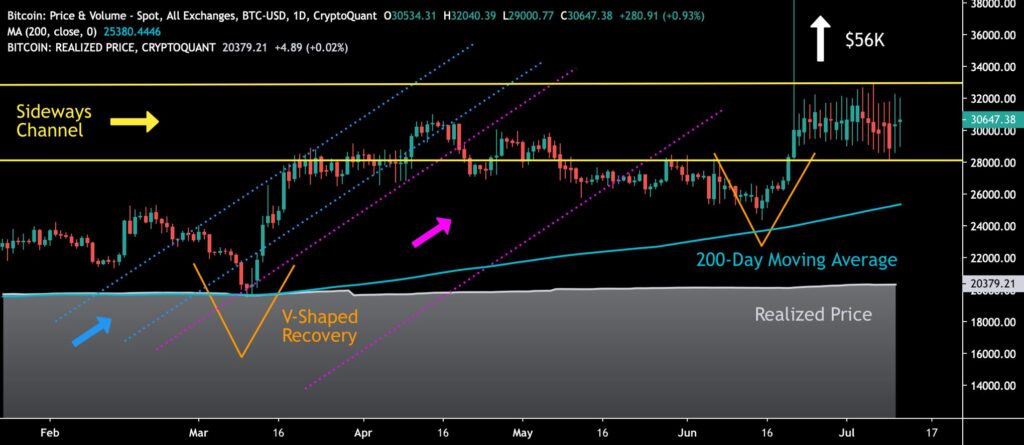
Sources: Timo Oinonen, CryptoQuant
According to the Material Indicators heat map, the demand for bitcoin appears to be strengthening around the $31 500 to $32 000 levels. The Cumulative Volume Delta (CVD) indicates that whales are currently in a buying mood.
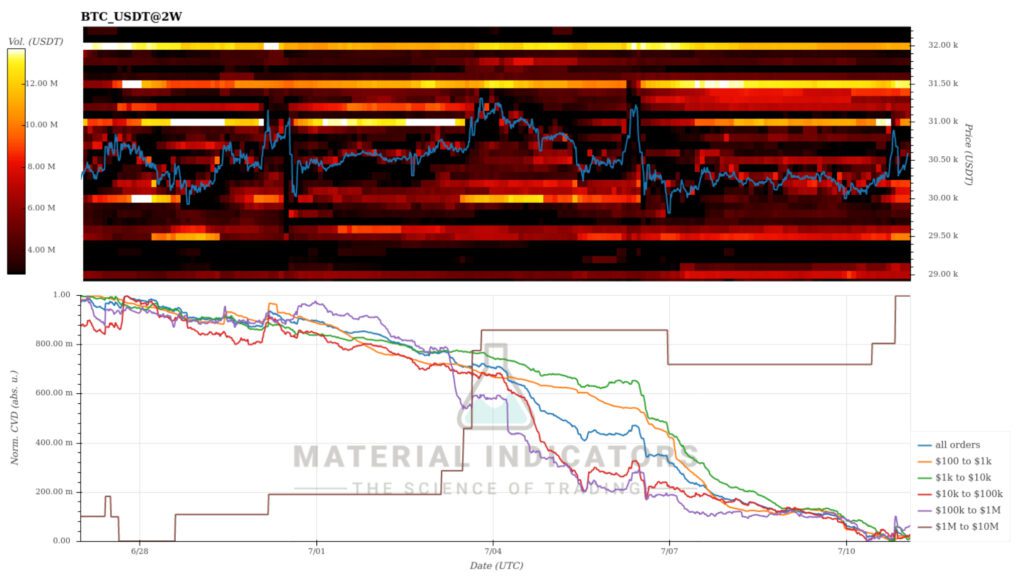
Source: Material Indicators
As bitcoin moves almost sideways on a weekly basis, altcoins have clearly weakened more. Litecoin, which will meet its halving event in 21 days, experienced the biggest drop on the list, weakening by -7,1 percent. The market is still adjusting to the recent commodity and security segmentations by the U.S. Securities and Exchange Commission SEC, which clearly support the position of bitcoin and Ethereum. The stock index S&P 500 and gold weakened slightly.
7-Day Price Performance
The Correlation Between Bitcoin and Altcoins Continues to Weaken
After an epoch of tighter correlation in the spring, the relationship between bitcoin and altcoins is once again significantly weakening, with higher-beta tokens diverging from the leading cryptocurrency. Among the tokens listed on the Coinmotion platform, only the correlation between Ethereum and bitcoin remains high, at a reading of 0,87.
On the other hand, the depenence between bitcoin and other cryptocurrencies is experiencing a notable downward spiral, with the correlation between Uniswap and bitcoin dropping to 0,42. The same category, starting with 0,4, includes Aave, Litecoin, Stellar, and XRP. The correlation between Chainlink and bitcoin is slightly higher at 0,64, but it also shows a downward trend.
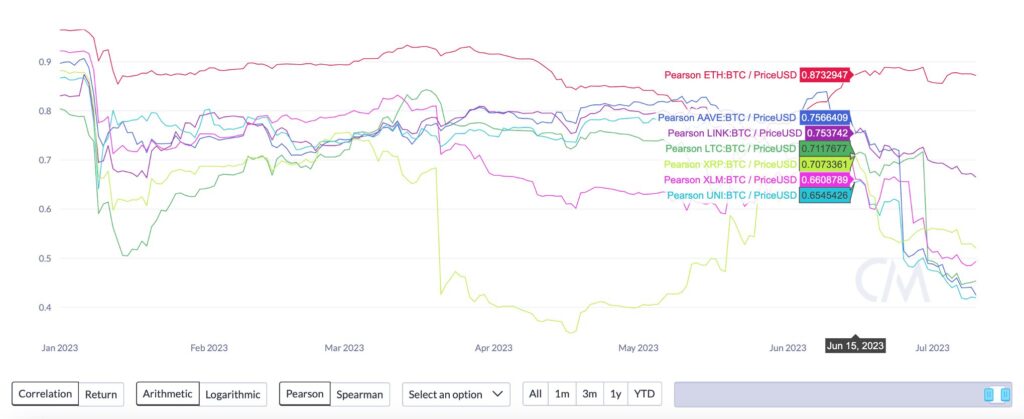
Source: Coin Metrics
The weakening correlations are driven by the diverging price movements of cryptocurrencies since the beginning of the year. Bitcoin leads the spot price development among the cryptocurrencies listed on Coinmotion, rising by 84,01 year-to-date. Ethereum is the second strongest performer, with a gain of 56,28 percent. The unusually weak correlation between Uniswap and bitcoin can be explained by the negative price performance of UNIUSD, which has decreased by -0,69 percent year-to-date.
Read more: What is Uniswap? UNI Crypto Guide
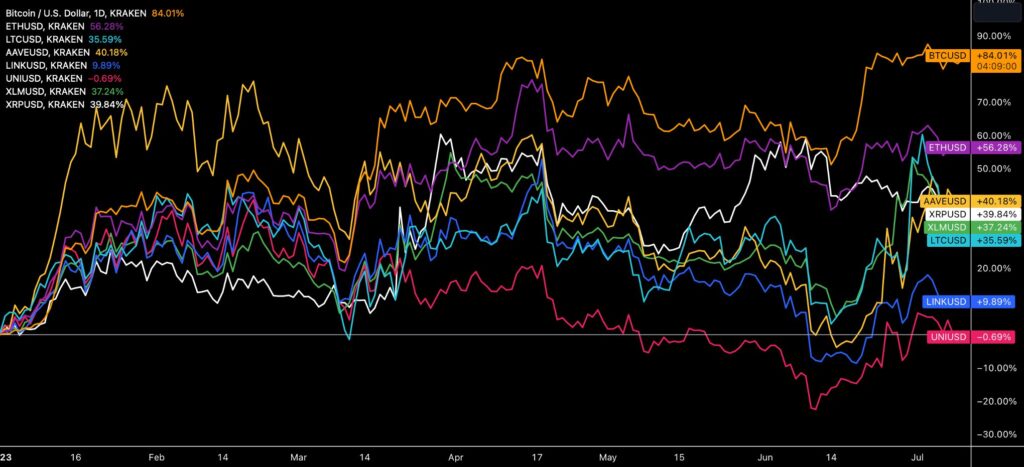
Source: TradingView
SEC Segmentation Still Divides the Market
On June 5th, the U.S. Securities and Exchange Commission (SEC) announced that it was suing the Binance.US platform and its CEO known as Changpeng Zhao (CZ). Binance is facing a total of 13 charges, including operating the exchange without proper licensing.
The SEC’s attack continued on June 6th, as it sued Coinbase. Coinbase is accused of selling unregistered securities, among other charges. These regulatory actions against these two major exchanges have brought clear selling pressure to the market. Binance-related tokens have naturally been hit harder.
Simultaneously, the U.S. Securities and Exchange Commission classified cryptocurrencies and tokens into two main groups: “commodity tokens” and “security tokens.” This radical categorization places only bitcoin and Ethereum in the commodity group, thereby securing their status. Most altcoins fall into the latter security token category, making their utilization challenging in the United States.
Some of the tokens classified as security tokens include SOL, ADA, MATIC, FIL, SAND, AXS, CHZ, ICP, NEAR, VGX, DASH, FLOW, MANA, ALGO, NEXO, ATOM, BNB, BUSD, and COTI.
The SEC’s segmentation continues to divide the market, with commodity-classified cryptocurrencies (orange) rising nearly 10% after June 4th. On the other hand, security-classified tokens have declined by -20% since the SEC’s decision, with no immediate correction in sight.
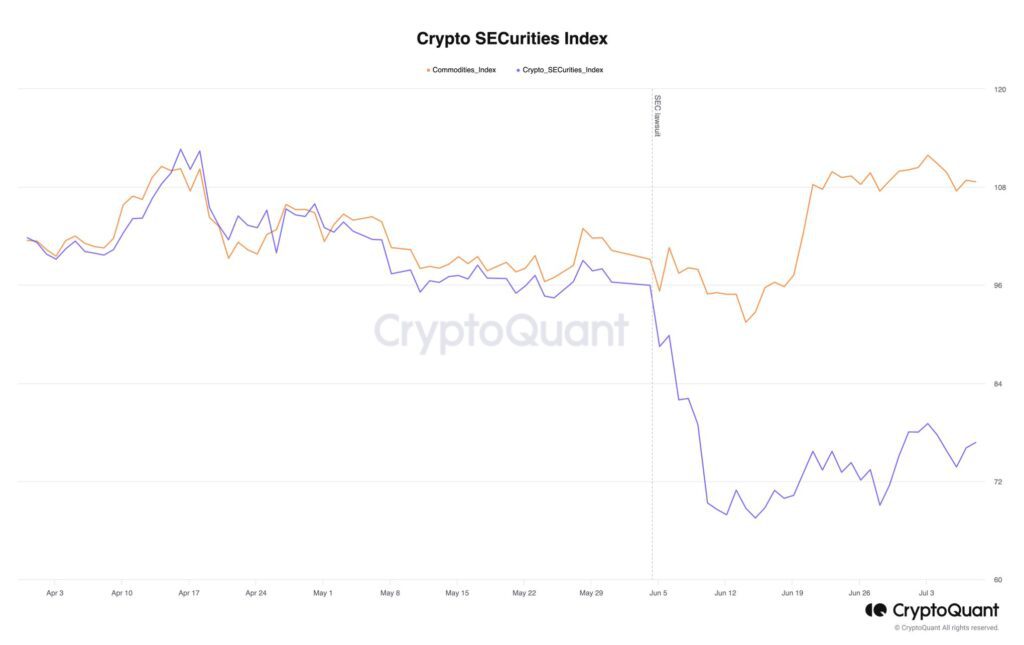
Source: CryptoQuant
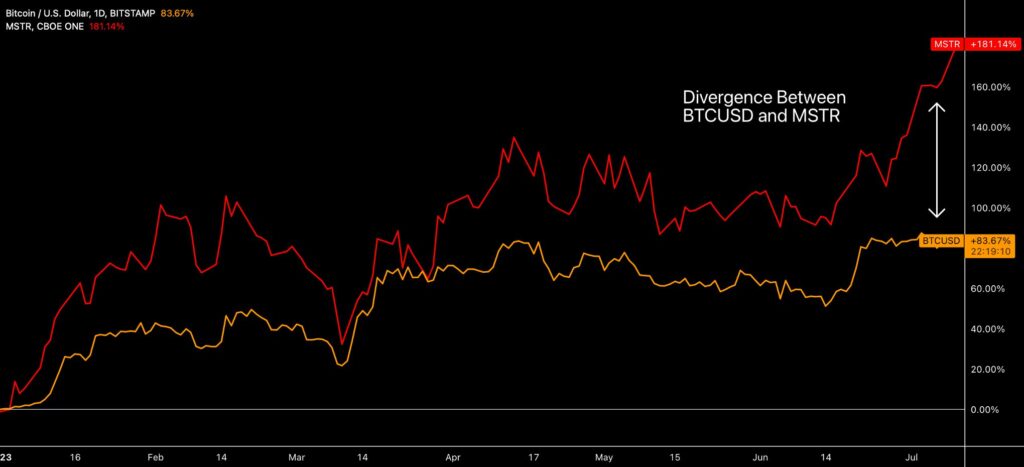
MicroStrategy as a Leading Indicator
After the deep bear cycle of 2022, the year 2023 has started off strongly for bitcoin, with the cryptocurrency (orange) rising by 83,67 percent since the beginning of the year. As we demonstrated in the previous chart, bitcoin has clearly outperformed other cryptocurrencies listed on Coinmotion. With the market currently at a turning point, investors are eagerly awaiting a clear signal regarding its future direction.
One relevant signal is the performance of MicroStrategy’s MSTR stock (red), which has strengthened by 181,14% this year. MicroStrategy can be seen as reflecting investors’ market expectations and acting as a leading indicator for bitcoin. Furthermore, the MSTR stock and bitcoin exhibit reflexive behavior, representing both being tied to bitcoin-related assets.
George Soros’s theory of reflexivity examines the impact of positive feedback loops on investors’ expectations and reality. The divergence between the two can lead to price trends that significantly deviate from equilibrium prices.
Source: TradingView
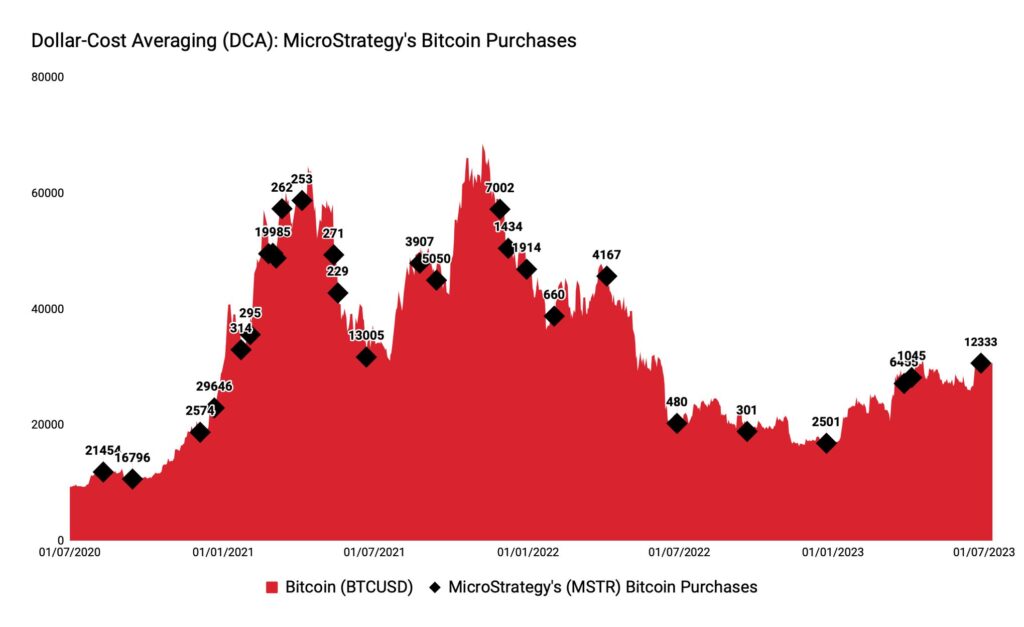
Michael Saylor and his company MicroStrategy, founded in 1989, have emerged as pioneers in institutional Bitcoin investment. The turning point for the company came in July 2020 when Saylor announced the replacement of the company’s dollar reserves with bitcoin and alternative assets. Michael Saylor is also known for his Bitcoin theses, which include defensive, opportunistic, and strategic arguments.
The accompanying chart, constructed by Coinmotion Research, provides an overview of MicroStrategy’s bitcoin acquisitions. As the chart indicates, the company actively accumulated bitcoin in 2020 and 2021, but purchases were modest in the previous year. In 2023, the pace has accelerated once again, with the company acquiring a total of 19 833 bitcoin units since January.
Source: Coinmotion Research
MicroStrategy has been considered an indicator of institutional appetite, and its purchases in the early part of the year can be seen as a sign of broader market recovery. Entities like MicroStrategy are among the first to increase their bitcoin exposure following a market turning point.
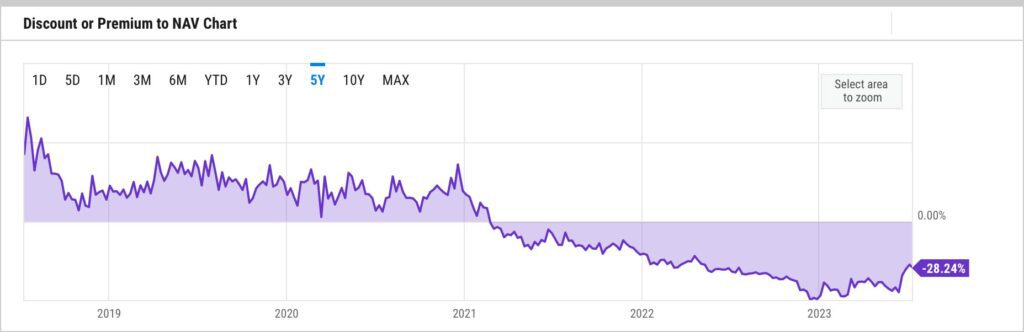
The GBTC Premium at the Highest Level in 12 Months
Founded in 2013, Grayscale is one of the iconic Bitcoin companies in the industry, known for its cryptocurrency funds such as GBTC and ETHE. Grayscale Bitcoin Trust, or GBTC, has long been regarded as the most pragmatic institutional bitcoin instrument, and its monopoly position allowed for substantial management fees (2%). Recently, Grayscale has faced increasing competition from new ETF funds, first in Canada and then in the United States. Grayscale’s plan is to convert GBTC into a spot ETF fund as soon as possible.
Source: YCharts
One of the most interesting features of GBTC has been its premium, which reached its peak at 132,6% at the end of May 2017. However, since 2021, the premium has been in a declining trend, dropping from 29% in January 2021 to nearly -50% by the end of 2022. The falling premium (or discount) was a leading indicator for bitcoin in previous years.
Now, the premium is showing clear signs of recovery, rising from -46% at the beginning of January to the current -28%. The increasing premium reflects the overall market’s recovery. Investors who are comfortable with a higher risk profile can still acquire GBTC shares at a “discount” of 28% and potentially benefit from the anticipated ETF listing in the future. This blue sky scenario assumes, of course, that the spot ETF will be approved, ceteris paribus.
What Are We Following Right Now?
Mark Yusko analyzes BlackRock’s ETF application and its tremendous potential.

Glassnode’s comprehensive on-chain market analysis delves into the confluence zone at $30 000, examining it closely and providing insights into its significance.

Robert Breedlove and Peter McCormack engage in a discussion about Bitcoin, economics, and mimetic behavior.

Stay in the loop of the latest crypto events
- Is Bitcoin Approaching a Supply Shock?
- Coinmotion Adds Two New Strategic Board Members to Strengthen its Position in the Digital Currency Market
- Bitcoin’s Grand Return to $30K
- Bitcoin Decouples from the Stock Market and Altcoin Correlations
- Ripple (XRP): Empowering the future of digital currency
- The Déjà Vu of Bitcoin Dominance
- Coinmotion Teams Up with Fenergo for the Next Level in AML Compliance
- Is Web3 the future of the Internet?

The views, thoughts, and opinions expressed in the text belong to the author and not necessarily to the author’s employer, organization, committee, or other group or individual.