

The technical analysis of week 26 delves into the market cycles and reflexivity of bitcoin. Additionally, we will map the market using technical and fundamental tools. At the same time, we will examine the zero correlation between bitcoin and the stock market.
The positive momentum of the cryptocurrency market continues for the third week, even though the price development of bitcoin in the past seven days has been cautious. Nevertheless, the leading cryptocurrency has managed to strengthen by 13,6 percent in two weeks and over 80% since the beginning of the year. Bitcoin has clearly gained momentum from institutions in June and July. On Wednesday, Larry Fink of BlackRock commented on the leading cryptocurrency as follows:
“Bitcoin is digitizing gold. Instead of investing in gold as a hedge against inflation, bitcoin can represent an asset that people can play as an alternative. Bitcoin is an international asset.”
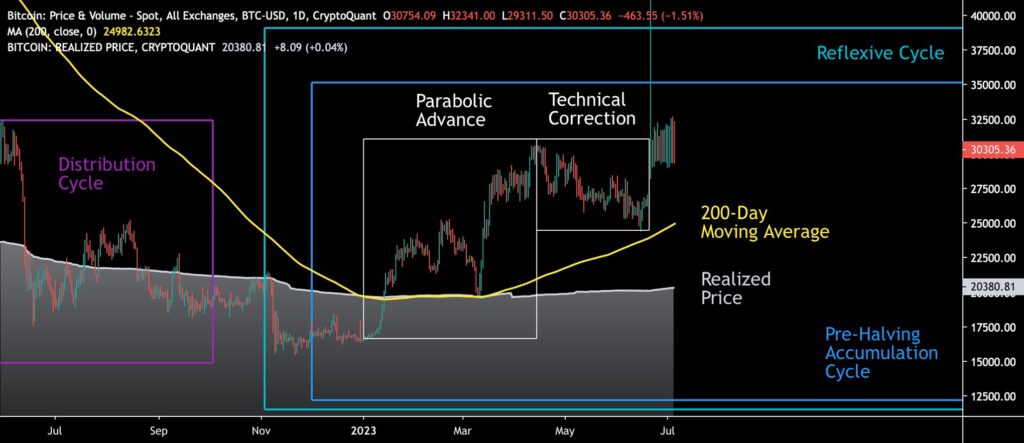
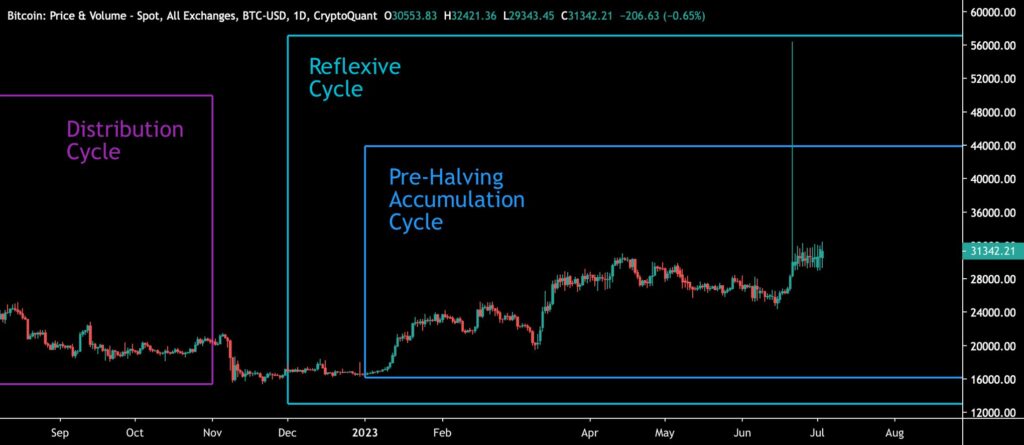
At the end of 2022, bitcoin encountered a technical inflection point, which can be seen as a multi-year watershed moment for the market. At this inflection point, bitcoin’s upward and downward spot trend lines converged, propelling the cryptocurrency into a new market cycle.
The market transitioned into a parabolic price trend in early spring (white), followed by a technical correction. Bitcoin’s spot price is supported by a steeply rising 200-day moving average (yellow) and the realized price wave (gray).
In the bigger picture, bitcoin has now shifted from a distribution cycle (violet) to the current accumulation cycle (blue) preceding the halving event. At the same time, the bitcoin market exhibits new reflexivity, which we will explore further in this technical analysis.
Sources: Timo Oinonen, CryptoQuant
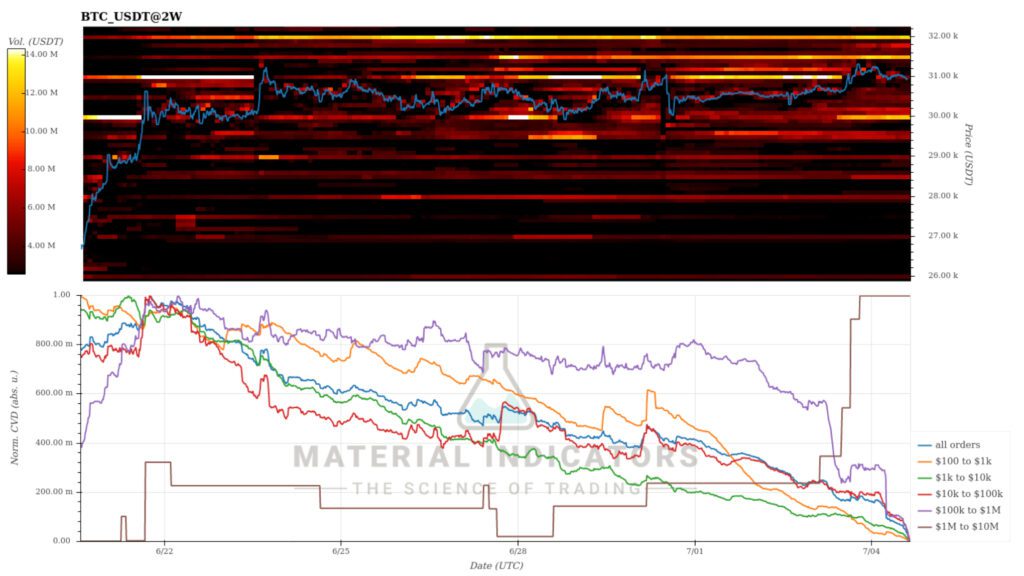
Material Indicators’ heat map suggests that demand will remain strong in July. The Cumulative Volume Delta (CVD) indicator continues to indicate accumulation mode in the whale category (brown).
Source: Material Indicators
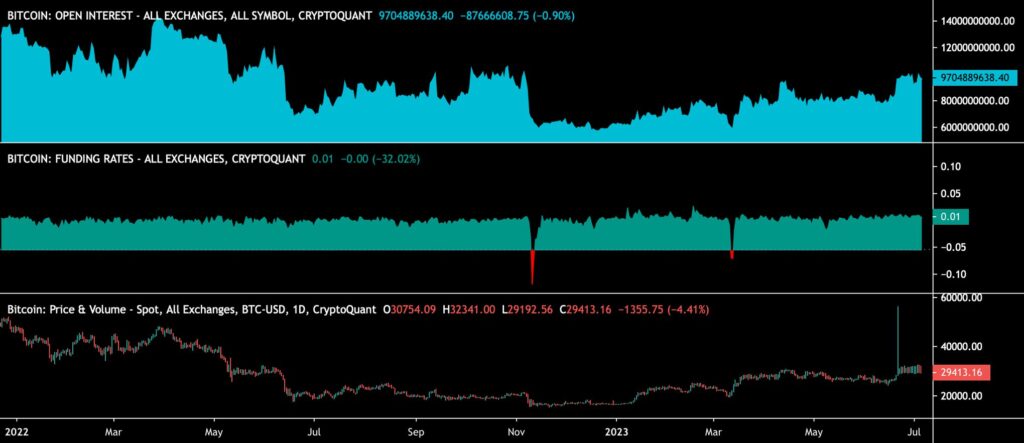
The recent BlackRock ETF application, which has been boosting the bitcoin market, immediately reflected in the derivative market, increasing the open interest (OI) of derivative contracts by nearly 30 percent.
The rise in open interest indicates the emergence of the Fear of Missing Out (FOMO) phenomenon, which typically leads to an increase in retail demand. At the same time, there are clear signs of the return of institutional renaissance. The rising OI and long derivative positions also raise the risk of a short-squeeze situation.
Sources: Timo Oinonen, CryptoQuant
As bitcoin has strengthened moderately within a seven-day time frame, there are clear breakouts observed in some altcoins. Litecoin, which will undergo its halving event in 27 days, has risen by 23,8 percent in a week, with investors directing their expectations towards it. Aave, a decentralized finance platform with Finnish origins, has gained 24,4 percent compared to last week. Both the S&P 500 stock market main index and gold saw an increase of nearly two percent over the week.
7-Day Price Performance
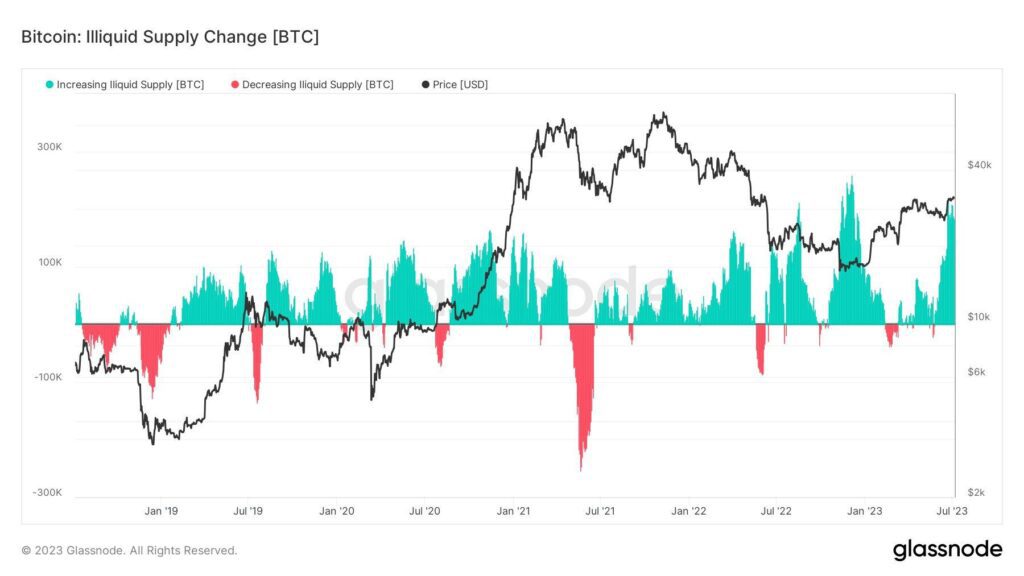
Bitcoin’s Growing Illiquid Supply
In the past 30 days, Bitcoin’s illiquid supply has increased by over 200 000 units, while bitcoin exchange reserves are at their lowest level since 2018. Recently, Rational Root analysts estimated that 75 percent of bitcoin’s supply is illiquid.
So, what does illiquid supply mean? Bitcoin’s illiquid supply refers to a situation where a significant portion of the existing bitcoins are locked up for the long term and are available in limited quantities or not at all for active trading. Illiquid supply impacts the price of bitcoin, as limited availability increases demand and usually drives up the price. Illiquid supply can also cause a situation called “supply shock.”
Source: Glassnode
The illiquid supply is influenced by various factors, including:
[A] Long-term investment: Many investors view bitcoin as a long-term store of value or a hedge. If these investors are not actively trading, it can contribute to illiquid supply.
[B] HODL behavior: Particularly among older bitcoin enthusiasts, there is a tendency to avoid selling their holdings until the last moment. These holders are often referred to as “holders of last resort.”
[C] Lost bitcoins: The Bitcoin network was launched in 2009, so its history is relatively long. Early-stage investors, in particular, may have lost their keys or, for other reasons, cannot access their units. These bitcoins are considered lost and are not counted as part of the circulating supply.
Bitcoin Enters a Reflexive Cycle
As Bitcoin’s creator Satoshi Nakamoto famously said:
“It might make sense just to get some in case it catches on. If enough people think the same way, that becomes a self-fulfilling prophecy.”
Satoshi’s statement refers to Bitcoin’s network traction per se; however, it can also be interpreted as a message about reflexivity. Originally proposed by George Soros, reflexivity is a theory that positive feedback loops between expectations and economic fundamentals can cause price trends that substantially and persistently deviate from equilibrium prices.
Bitcoin has always been characterized by strong reflexivity. Bitcoin’s positive cycles are likely to continue for extended time periods; however, bitcoin’s negative cycles are notorious for their length and depth.
After meeting its technical and on-chain watershed in late 2022, bitcoin shifted into a new paradigm in early 2023. The leading cryptocurrency is up almost 100 percent year-to-date, mirroring a demand renaissance. Supported by a positive feedback loop, bitcoin has also moved into a new reflexive cycle (turquoise).
In the broader picture, bitcoin’s market behavior can be segmented into accumulation (blue) and distribution (violet) phases, which together form a multi-year series of cycles.
Institutional money has traditionally favored accumulation cycles, while retail investors have been active in distribution cycles. Bitcoin’s history is also defined by halving events, which are always preceded by a pre-halving accumulation cycle.
Praeterea, bitcoin’s path, is currently supported by multiple macro-level factors. First, bitcoin has shifted from a distribution cycle to a pre-halving accumulation cycle, looking toward the spring 2024 halving. Additionally, bitcoin is now being uplifted by reflexivity, and the leading cryptocurrency correlates with stocks like Coinbase (COIN), which has strengthened 138 percent this year.
Sources: Timo Oinonen, CryptoQuant
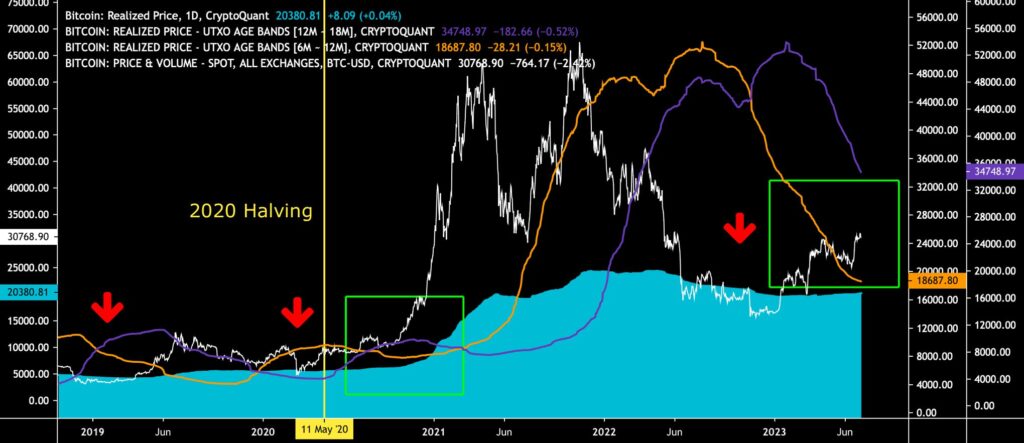
Realized Price in a Moderate Ascent
The nearly 20 percent strengthening of bitcoin in the past month has also triggered movement in the realized price (turquoise). During the parabolic price development in the spring, bitcoin formed a divergence with the realized price, which has now clearly surpassed $20 000. The realized price is seen as a market watershed because it represents the average price of all bitcoin purchases. Additionally, a spot price exceeding the realized price indicates that bitcoin investors are in profit with their investments.
Sources: Timo Oinonen, CryptoQuant
The spot price (white) and the 6M-12M wave of the realized price (orange) now create a situation reminiscent of the year 2020, where the spot rose above the orange wave. The same phenomenon occurred during the correction of the summer of 2019. Historically, this structure has indicated an upward price cycle.
Near Zero Correlation Between Bitcoin and Stock Market
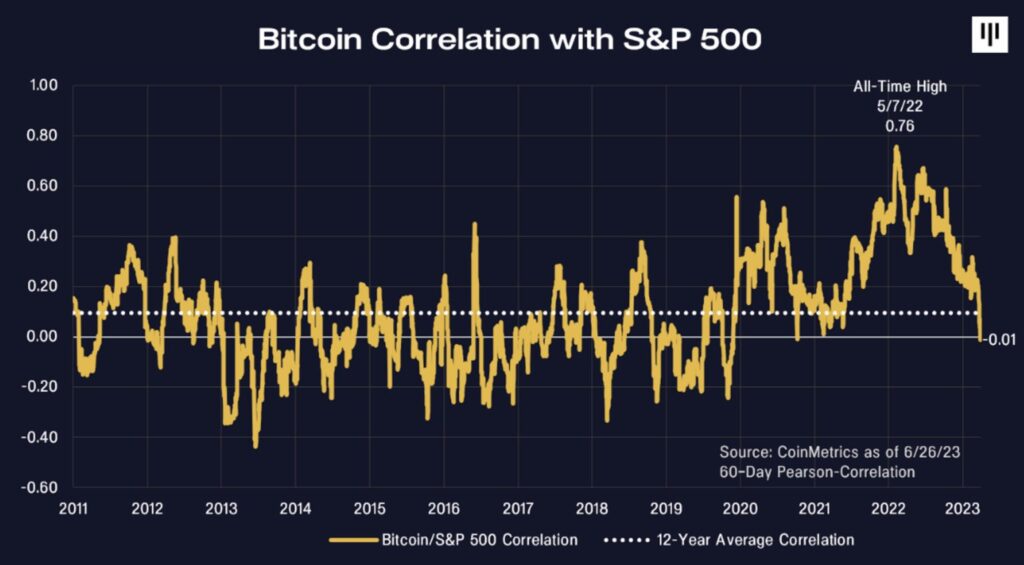
Bitcoin was long considered a so-called “uncorrelated asset,” with its price movements occurring independently of traditional asset classes. This narrative held true, especially in the early years of cryptocurrency, when its correlation with the S&P 500 index was close to zero. However, the situation changed in 2020 when Michael Saylor launched his famous Bitcoin theses and made significant bitcoin allocations through his company, MicroStrategy (MSTR). With the rise of institutional interest, bitcoin’s correlation with the stock market increased.
Now, bitcoin is once again returning to its roots of near-zero correlation with the stock market. A chart from Pantera Capital illustrates how after the sharp rise in 2021-2022, bitcoin’s correlation has dropped to the zero line and even slightly below it. It is interesting to observe whether the correlation between bitcoin and the stock market will now become significantly negative.
Source: Pantera Capital
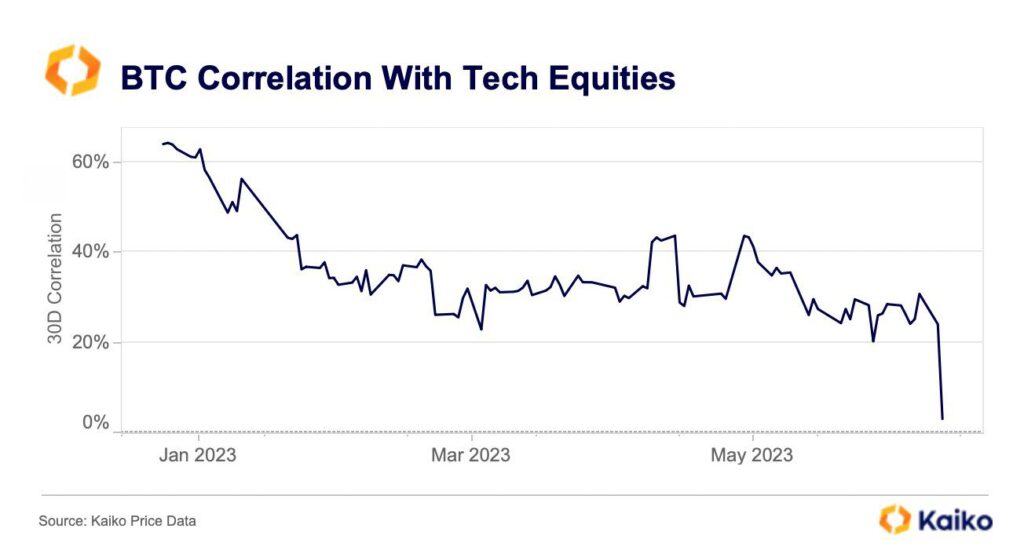
In addition to the S&P 500 index, bitcoin’s correlation with technology stocks has fallen significantly. According to Kaiko’s chart, the correlation between bitcoin and tech stocks is now close to zero, creating an exceptional setup. Bitcoin’s correlation to Coinbase’s COIN stock, which is up more than 133 percent since the beginning of the year, remains strong.
Source: Kaiko
What Are We Following Right Now?
Danish Saxo Bank has unexpectedly received a crypto-related trading ban from the country’s authorities.
Glassnode’s comprehensive guide on analyzing short-term (STH) and long-term (LTH) investors.

Is inflation driving the central banks into a corner once and for all? Analyst Lyn Alden opens up her views on the subject.

Stay in the loop of the latest crypto events
- Coinmotion Adds Two New Strategic Board Members to Strengthen its Position in the Digital Currency Market
- Bitcoin’s Grand Return to $30K
- Bitcoin Decouples from the Stock Market and Altcoin Correlations
- Ripple (XRP): Empowering the future of digital currency
- The Déjà Vu of Bitcoin Dominance
- Coinmotion Teams Up with Fenergo for the Next Level in AML Compliance
- Is Web3 the future of the Internet?

The views, thoughts, and opinions expressed in the text belong to the author and not necessarily to the author’s employer, organization, committee, or other group or individual.