The TA of week 30 explores the market’s weekly movements, with a particular focus on Litecoin’s halving event. Additionally, we delve into the escalating dominance of stablecoin Tether and bitcoin’s negative correlation with the stock market.
The overall trend of the cryptocurrency market continues to be moderately bearish, with bitcoin attempting to hold its ground at the $30 000 level. This week, the market is spiced up by Litecoin’s halving event, which cuts the cryptocurrency’s block reward from 12,5 to 6,25. The halving increases the relative scarcity of Litecoin.
Despite the market clearly being in a “summer vacation mood,” several experts remain optimistic about bitcoin’s prospects. Blockchain analytics firm CryptoQuant’s Ki Young Ju sees bitcoin still being in a bullish cycle. According to Ju, the realized price indicates that 71% of bitcoins are inactive in trading. He interprets this phenomenon as a sign of low selling pressure.
“Bitcoin still in a bull cycle. Approximately 71% of realized cap is unmoved BTC (> 6 months), indicating low selling pressure from long-term holders currently. Lower selling pressure doesn’t guarantee a price increase, but it’s less likely BTC is in the cyclic top at least.” – Ki Young Ju
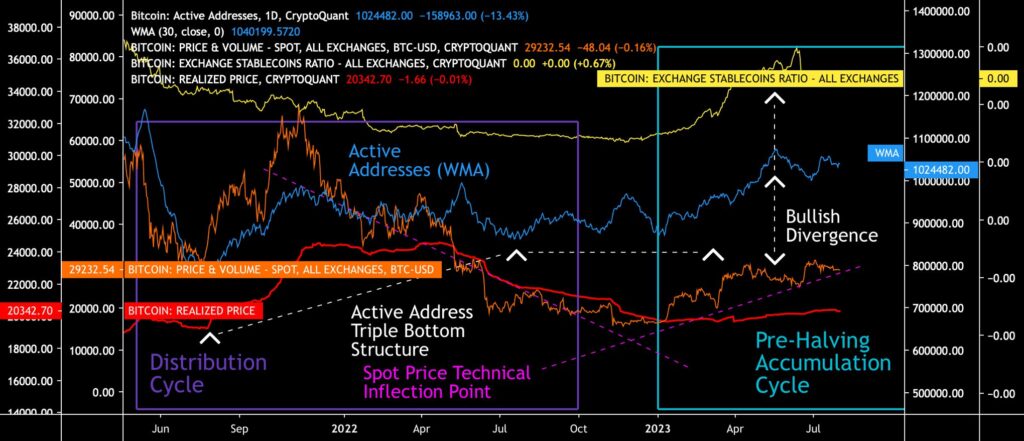
Bitcoin’s technical setup continues its classical pattern, with the realized price (red) providing support to the price. Bitcoin is following its upward channel (pink) formed after the late 2022 technical breakout. At the same time, bitcoin’s triple bottom pattern of active addresses (white) and the increasing number of addresses indicate the network’s vitality.
Sources: Timo Oinonen, CryptoQuant
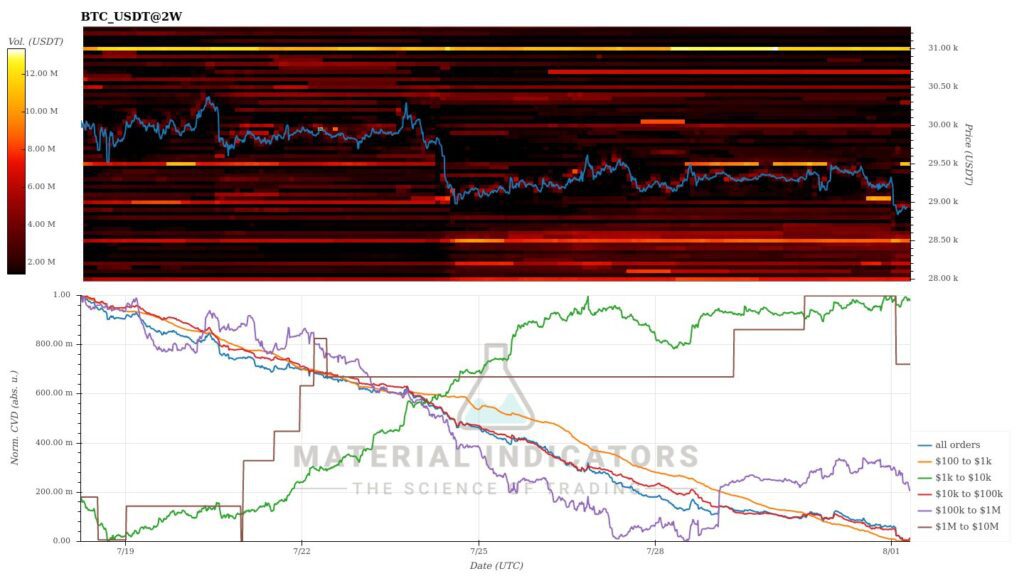
Material Indicators’ heat map indicates the strengthening of the $28 500 support level, as traders brace for a potential spot price decline. There is a clear demand spike in the range of $28 000 to $28 500. The cumulative volume delta indicates whale accumulation, which might have potentially reached a temporary peak.
Source: Material Indicators
The cryptocurrency market has continued to be moderately bearish since last week, with bitcoin weakening by -0,6%. Litecoin, which has already experienced its halving event, has not seen an increase in momentum, as it weakened by -1,7%. During the same period, the S&P 500 stock index declined by approximately -1%, while gold traded in a relatively sideways manner.
Seven Day Price Performance
Bitcoin (BTC): -0,6 %
Ethereum (ETH): -1,4 %
Litecoin (LTC): -1,7 %
Aave (AAVE): -8,3 %
Chainlink (LINK): -1,2 %
Uniswap (UNI): 6,6 %
Stellar (XLM): 1,6 %
XRP: -2,2 %
Get started with Bitcoin Litecoin Ethereum AAVE USDC Stellar Ripple
Join Coinmotion and buy your first cryptocurrencies within minutes!
S&P 500 Index: -1,1 %
Gold: -0,1 %
XRP, classified as a commodity, and Stellar, driven by classification speculations, continue to be at the top of the tokens listed on Coinmotion, with both having risen over 100% since the beginning of the year. The leading cryptocurrency bitcoin divides the market, amplifying the divergence between assets like XRP and Uniswap.

Source: TradingView
As of the beginning of June, the segmentation created by the U.S. Securities and Exchange Commission (SEC) continues to act as a market watershed. The commission divided cryptocurrencies and tokens into two main groups, one being “commodity tokens” and the other “security tokens.” The radical classification originally placed only bitcoin and Ethereum in the commodity group, thereby securing their status. Now, XRP can also be included in the commondity cohort.
Litecoin After the Halving
Litecoin, a classic cryptocurrency listed on Coinmotion, underwent its halving event in the early hours of Wednesday. This event occurs every four years and reduces Litecoin’s block reward by 50%, now dropping from 12,5 to 6,25 LTC. The halving takes place every 840 000 blocks.
The halving event improves the fundamentals of the Litecoin ecosystem by reducing the cryptocurrency’s supply, i.e., the number of new LTC units. As the supply decreases, the amount of available coins is lower, leading to increased scarcity. Scarcer supply typically drives up the price of a cryptocurrency.
In theory, the halving event also increases demand for the cryptocurrency as investors seek to capitalize on the decreasing supply. Additionally, the halving serves the predictability and continuity of the Litecoin protocol, providing a clear framework for the network’s operations. Investors can trust in the continued functioning of this Proof-of-Work (PoW) based protocol, making it more attractive for investment.

Source: Coinmotion Research
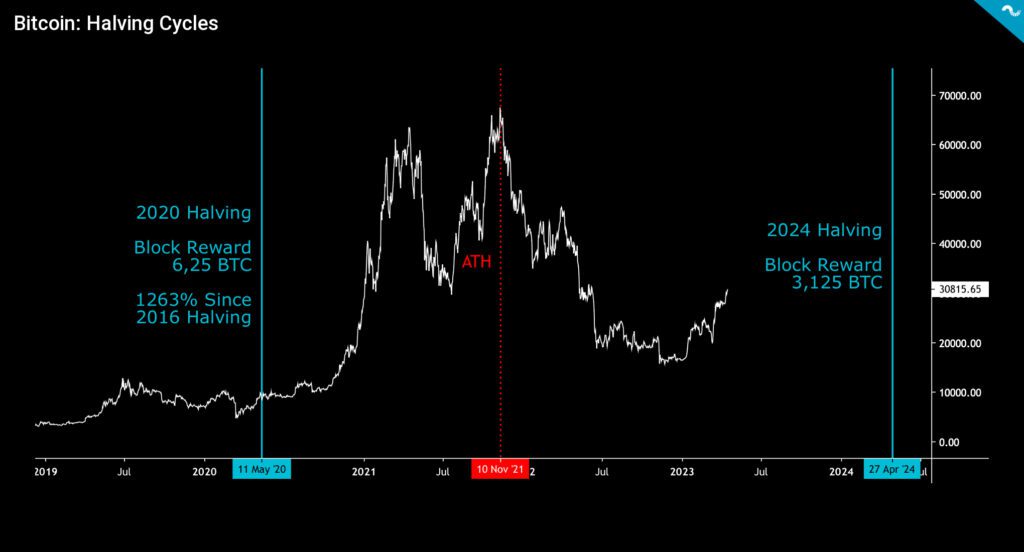
Litecoin’s halving precedes its sister currency bitcoin’s halving event, which will occur 253 days later in April 2024. In comparison to Litecoin, Bitcoin’s block reward will decrease to 3,125 units, instead of LTC’s 6,25.
Historically, bitcoin’s previous halving events have driven the spot price in a parabolic trend. Between the halvings of 2012 and 2016, the price surged by a total of 5187%. After the 2016 halving and the following all-time high (ATH) in the market, Bitcoin’s spot price climbed by 2922%.
It can be concluded that halving events generally serve as catalysts for price increases both before and after the halving. If bitcoin follows the structure of previous halving cycles, it’s possible to predict that the spot price may easily reach $100 000 after the 2024 halving event. As for Litecoin, it has strengthened by 23,55% since the beginning of the year.
Sources: Timo Oinonen, CryptoQuant
Tether’s Escalating Dominance
The popularity of stablecoins has continued its parabolic growth, with their market capitalization escalating from a few billion dollars in 2019 to over 100 billion dollars at present. The majority of stablecoins are pegged to the value of the U.S. Dollar (USD), with market leaders Tether (USDT) and USD Coin (USDC) dominating the field.
Stablecoins serve as the backbone of decentralized finance (DeFi) and they are designed to reduce the price volatility typically associated with traditional cryptocurrencies like bitcoin. Moreover, stablecoins’ features enable easier integration into the traditional financial system.
As of mid-2023, the stablecoin market is undergoing a new transformative phase, with Tether emerging as the clear market leader. In the embedded chart, Tether is divided into two chains, the Ethereum-based chain (green) and the Tron-based chain (blue), which together own nearly 70% of the market share.

Source: Coin Metrics
The origin of Tether, initially developed by the Taiwanese Bitfinex exchange, has been subject to some controversy. Bitfinex created Tether as a solution to its own banking issues, backing the currency with the company’s dollar deposits. There has been speculation about the true status of these deposits, but the market continues to have faith in Tether. Tether promises that each USDT unit is redeemable for one dollar on a 1:1 basis.
As Tether’s market share grows while the overall market contracts, it cannibalizes its smaller competitors. USD Coin (USDC, red), which reached its market cap peak around the beginning of 2021, has clearly weakened compared to its main competitor, Tether. At the same time, troubled Binance exchange’s BUSD and MakerDAO’s DAI are rapidly losing market share, falling into a marginal category compared to Tether.
Binance Under New Allegations, Outflows on the Rise
On June 5th, the U.S. Securities and Exchange Commission (SEC) announced that it is suing the Binance.US platform and its CEO Changpeng Zhao, also known as CZ. Binance had to address a total of 13 charges, including operating the exchange without the proper license.
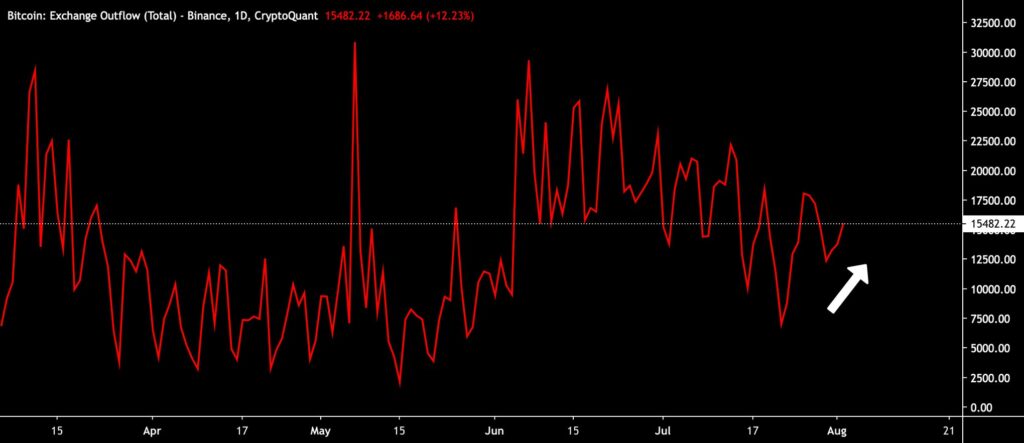
Binance’s regulatory problems continued this week, with Semafor reporting that the U.S. Department of Justice is bringing new charges against Binance. Speculations about the new charges led to a significant outflow of funds from the exchange (shown in red). Additionally, Binance’s native exchange token BNB has declined by -1,37% since the beginning of the year.
Source: Coin Metrics
The centralized structure of the cryptocurrency market sparked discussions in early 2023, as Binance’s spot market share rose to over 90%. The continued dominance of Binance is still seen as problematic because it makes the exchange the largest single point of vulnerability in the industry.
Bitcoin Negatively Correlated With the Stock Market
For a long time, bitcoin was considered a so-called non-correlated asset, meaning its price movements happened independently of traditional asset classes. This narrative held especially true during the early years of the cryptocurrency when its correlation with the S&P 500 index was close to zero. However, the situation changed in 2020 when Michael Saylor famously launched his Bitcoin thesis and made significant bitcoin allocations through his company MicroStrategy (MSTR). With increased institutional interest, bitcoin’s correlation with the stock market grew.
The correlation became significant in 2022, with bitcoin and technology stocks weakening together. However, the early part of 2023 marked a turning point in the correlation, causing it to plummet dramatically. From a correlation coefficient of 0,59 in January, the relationship between n´bitcoin and the stock market collapsed to negative -0,02. The latest data points indicate that bitcoin has completely decoupled from the direction of the stock market.
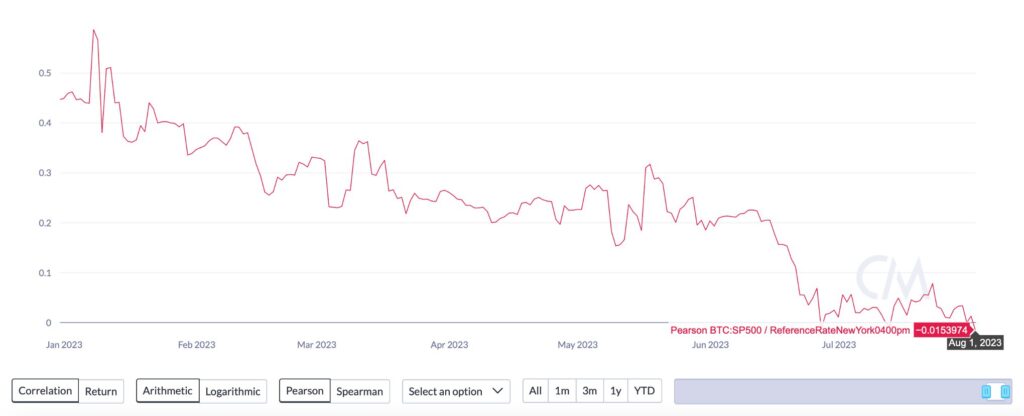
Source: Coin Metrics
What Are We Following Right Now?
MicroStrategy continued its bitcoin purchases in July, increasing its balance to 152 800 units.
In July, @MicroStrategy acquired an additional 467 BTC for $14.4 million and now holds 152,800 BTC. Please join us at 5pm ET as we discuss our Q2 2023 financial results and answer questions about the outlook for #BusinessIntelligence and #Bitcoin. $MSTR https://t.co/SCHeBJ80TH
— Michael Saylor⚡️ (@saylor) August 1, 2023
Lyn Alden shares her views on Bitcoin market ETF funds.
Oliver Linch’s (Bittrex) critical review of Central Bank Digital Currencies (CBDCs).
