
The TA for week 31 benchmarks Ethereum vs Bitcoin, exploring scarcity, EIP-1559, Proof of Stake, and other attributes.
ETH vs BTC: Correlated, Yet Fundamentally Different
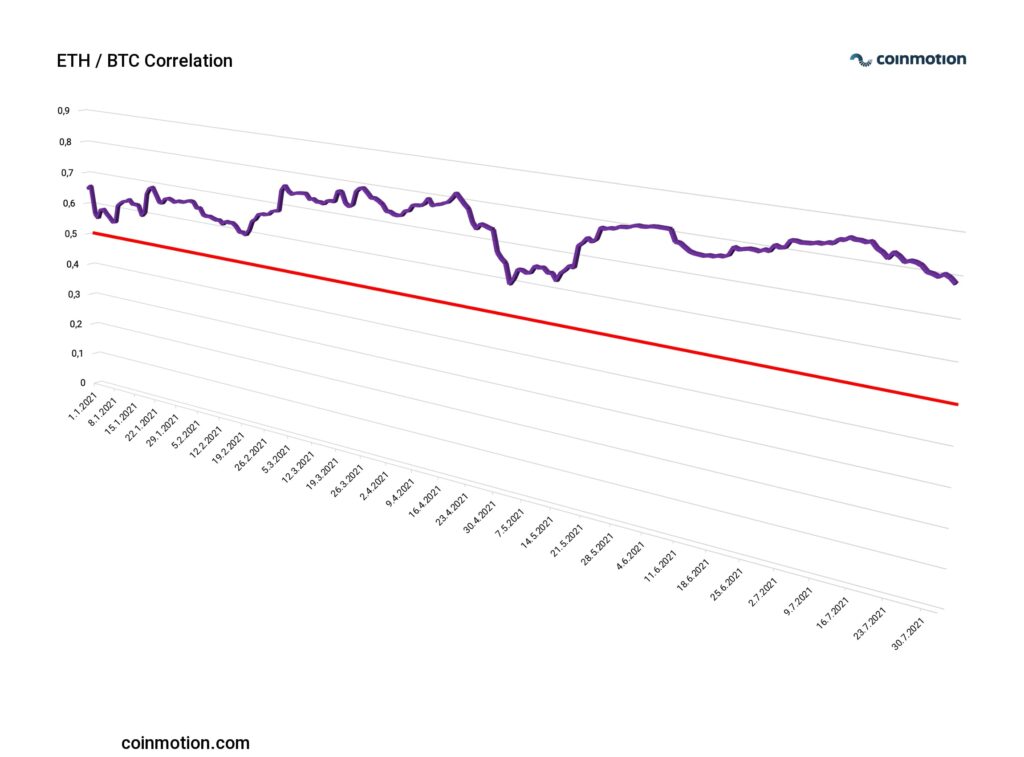
One of the most prominent questions arising from new crypto investors is: “Should I buy Bitcoin or Ethereum?” Those two leading digital assets have fundamentally different backgrounds and structures. However, their price action has been increasingly correlated. While the yearly ETH/BTC correlation was at a mere 0,41 in the 2017 bull market, it reached a stable 0,8 level from 2018 to 2020. This year the average ETH/BTC correlation has been 0,73.
ETH vs BTC correlation:
2016: 0,004
2017: 0,41
2018: 0,8
2019: 0,85
2020: 0,81
2021 YTD: 0,73
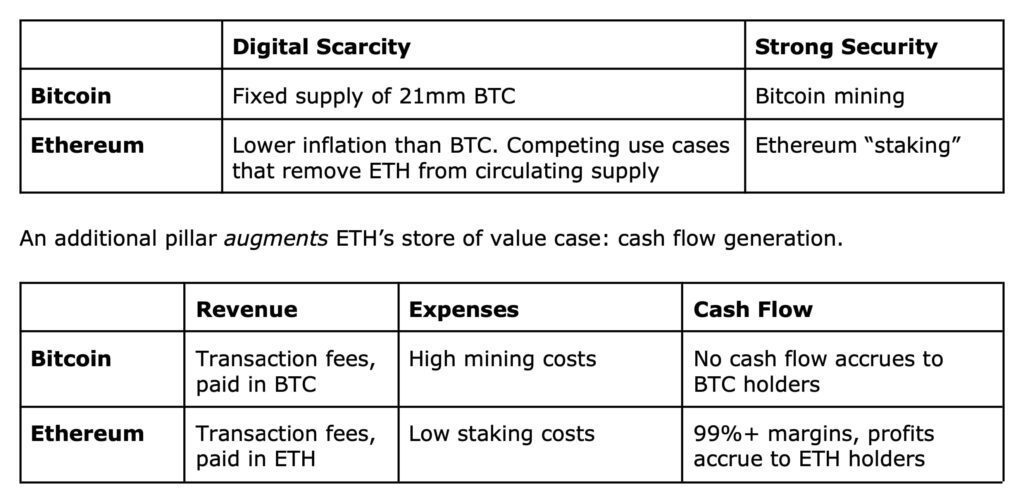
On a technical level, the two leading digital assets differ significantly: Bitcoin’s value proposition is a scarce gold-like asset, while Ethereum is more like a decentralized finance (DeFi) ecosystem. Bitcoin’s built-in scarcity stems from its maximum theoretical supply of 21 million units. While Ethereum doesn’t have a hard-capped supply, the upcoming EIP-1559 upgrade will make it more scarce by reducing the supply of ETH tokens.
ETH/BTC: Digital Gold or DeFi Cash Flows?
As mentioned, Bitcoin’s edge lies in its digital scarcity and potential as an alternative to gold. Bitcoin also carries scaling potential in the form of layer 2 Lightning Network. Like physical gold, Bitcoin doesn’t generate any cash flow; the allocator usually uses buy&hold strategy, expecting the scarce nature to uplift its price in the future.
Ethereum has a different approach path, as Ethereum accrues gas fees to ETH holders through staking and upcoming PoS structure. “Ethereum: A Store of Value with Cash Flow” report forecasts a $19,8 billion net income for Ethereum in 2022; the report also includes a discounted cash flow valuation, conservatively suggesting a $16 770 value per each ETH token. Institutions like Pantera Capital have estimated bitcoin’s price to reach $100 000 level in nearby years.
As mentioned before, Ethereum’s scarcity is about to increase after EIP-1559 (also known as the Ethereum London Hard Fork). Ethereum will reach its projected supply peak in early 2022, in parallel with PoW – PoS shift. Ethereum’s supply peak is estimated to be 119,4 million units.
Even though Ethereum is inching closer to Bitcoin, the scarcity attribute alone won’t make Ethereum ”sound money.” PoW-derived Bitcoin will likely remain the more censorship-resistant option, while Ethereum is more centralized.
Ethereum vs Bitcoin: Market Capitalization
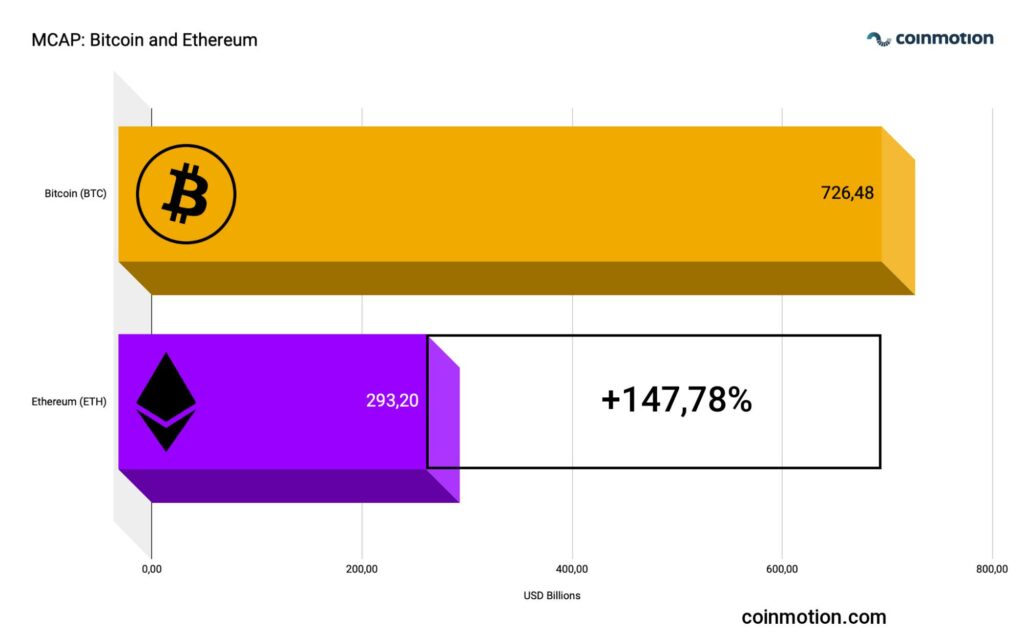
The market has been anticipating a possible BTC / ETH market capitalization flippening scenario, and the closest merges so far have been in February 2018 and May 2021. In February 2018, both assets momentarily approached $100 billion MCAP, and they tried to merge again around the $500 billion levels this May. Both occasions have been momentary anomalies, though, coinciding with cycle ends. Currently, ETH has under half of BTC’s market cap and would need to ascend 147,78 percent in order to meet Bitcoin.
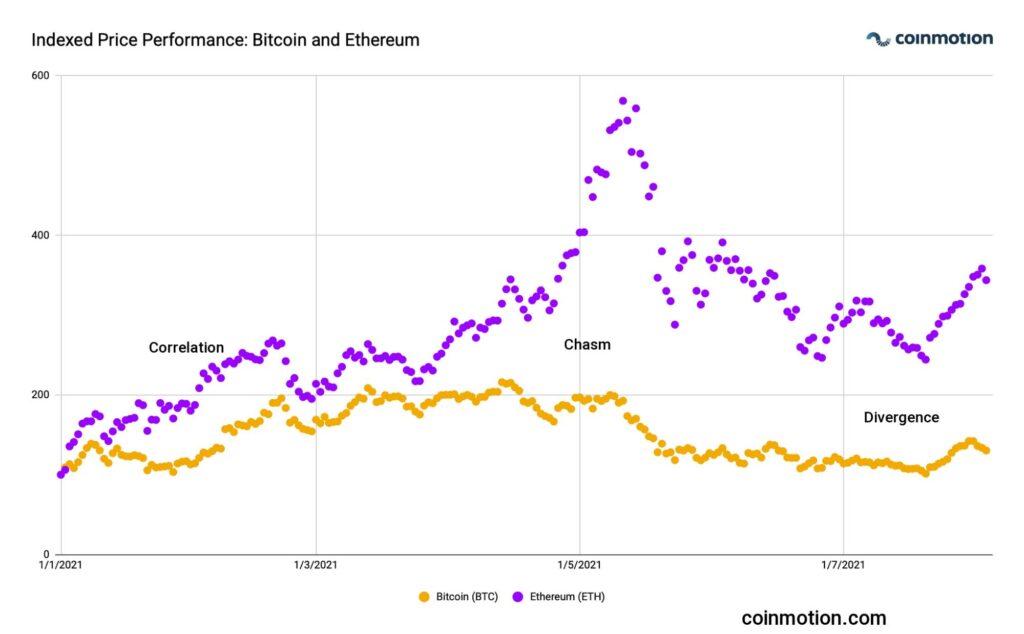
Ethereum vs Bitcoin: Price Performance
The price-performance of Bitcoin and Ethereum has been correlated, mirroring the maturity of two leading digital assets. During the 2021 bull cycle, Ethereum followed Bitcoin closely until its late-cycle breakout in May. After the May 2021 chasm, Ethereum continued to outperform Bitcoin, possibly fuelled by EIP-1559 related speculation.
ETH vs BTC: PoW vs PoS?
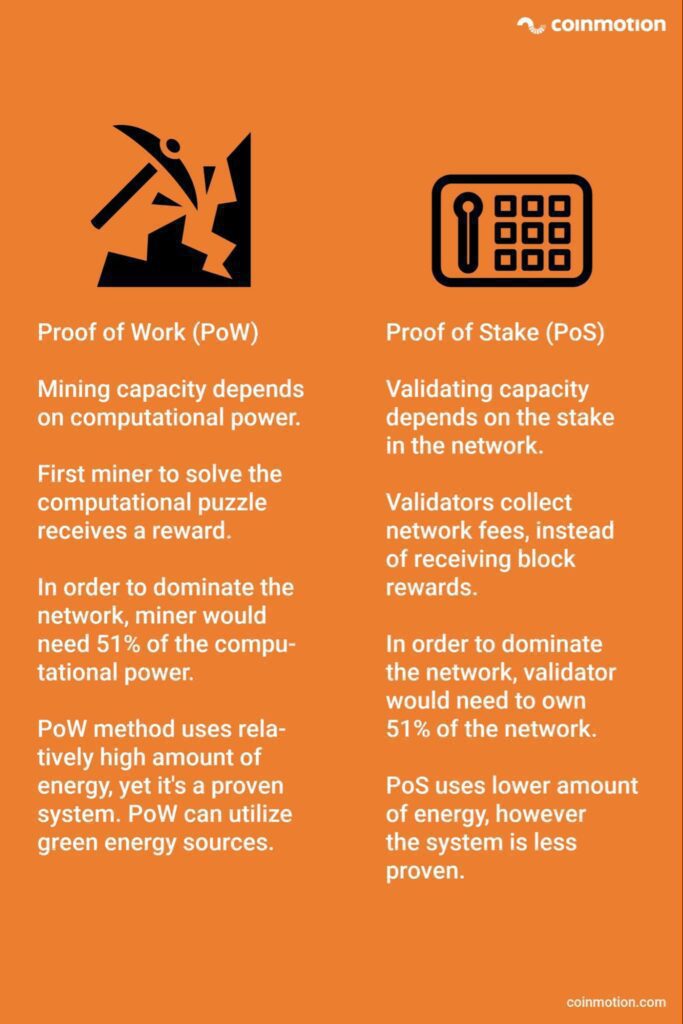
Whereas Bitcoin will most likely continue with the original Proof of Work (PoW) protocol, we expect Ethereum to shift into Proof of Stake (PoS) in early 2022. The PoW and PoS are fundamentally different, starting from PoW mining that revolves around computational power. In PoS, the blocks are not mined but validated by entities with enough stake.
In Proof of Work, the first miner to solve the computational puzzle gets the block reward, while in Proof of Stake, the network validators collect network fees, and to dominate the network, PoW users need 51 percent of the computational power, or in PoS, to own 51% of the network. Proof of Stake likely has an increased appeal to environmentally conscious users, as it allegedly uses less energy. Lower energy consumption would also make PoS (or future Ethereum) the preferred option for ESG investors and funds, even ETFs.
The downside of PoS is that it’s a relatively unproven system, while Proof of Work is well tested. PoW-based Bitcoin has been moving towards less energy consumption as well, via many (ex-China) miners opt for greener mining infrastructure.