

The Technical Analysis of week 42 evaluates bitcoin’s recent positive momentum and technical indicators. Additionally, we explore realized and delta caps and see why miners might have capitulated already.
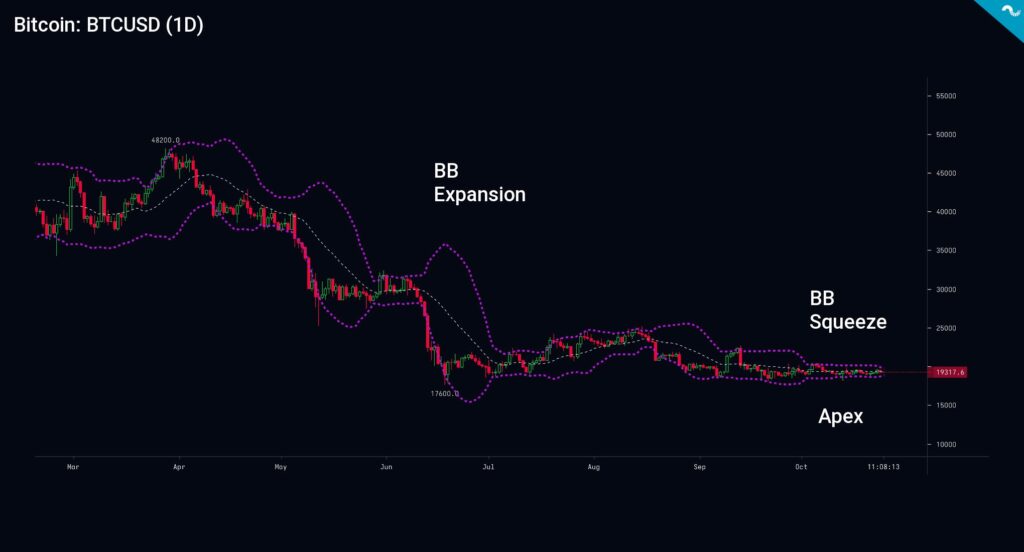
Bitcoin Closing in on BB Squeeze and Apex
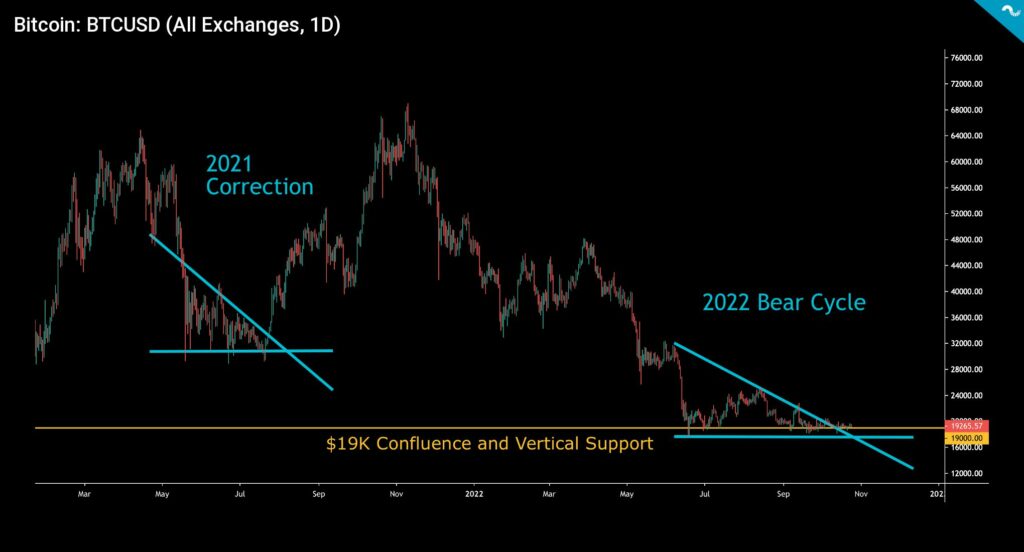
The digital asset markets gained significant momentum again on October 25th, as bitcoin strengthened over 5 percent in 24 hours. The leading decentralized finance platform Ethereum was up over 10 % on October 25th while gaining 13 % on a weekly basis. Bitcoin is currently trading above its seemingly infinite $19K confluence and vertical support zone (yellow). The current bear market might be approaching its inflection point, as bitcoin has already broken out of its technical wedge (turquoise). There’s a new pool of liquidity above $20 000, which could potentially give bitcoin more upward momentum.
The digital asset markets were supported by the weakening dollar index (DXY), which dropped from 112 level to 110 on Tuesday. Investors are also speculating on the possible pivot move of the central bank Fed, which analyst Luke Gromen estimates to be implemented in 2023. Fed’s return from QT to QE would be particularly beneficial to high beta assets.
Bitcoin’s Bollinger bands (violet) are squeezing the spot price hard, forming the tightest BB scenario so far in 2022. The Bollinger bands indicate escalating volatility as the technical structure soon meets the apex.
Bitcoin Resilient Amid The Asian Sell-Off
The Asian markets were frightened by Xi Jinping’s assumed lack of supportive policies and the continuation of the Chinese zero Covid policy. Hong Kong’s free-float-adjusted market-capitalization-weighted index Hang Seng dropped significantly on Monday when western investors sold en masse. Analysts have previously expressed concerns over the Chinese housing market, which is assessed to be hugely over-leveraged.
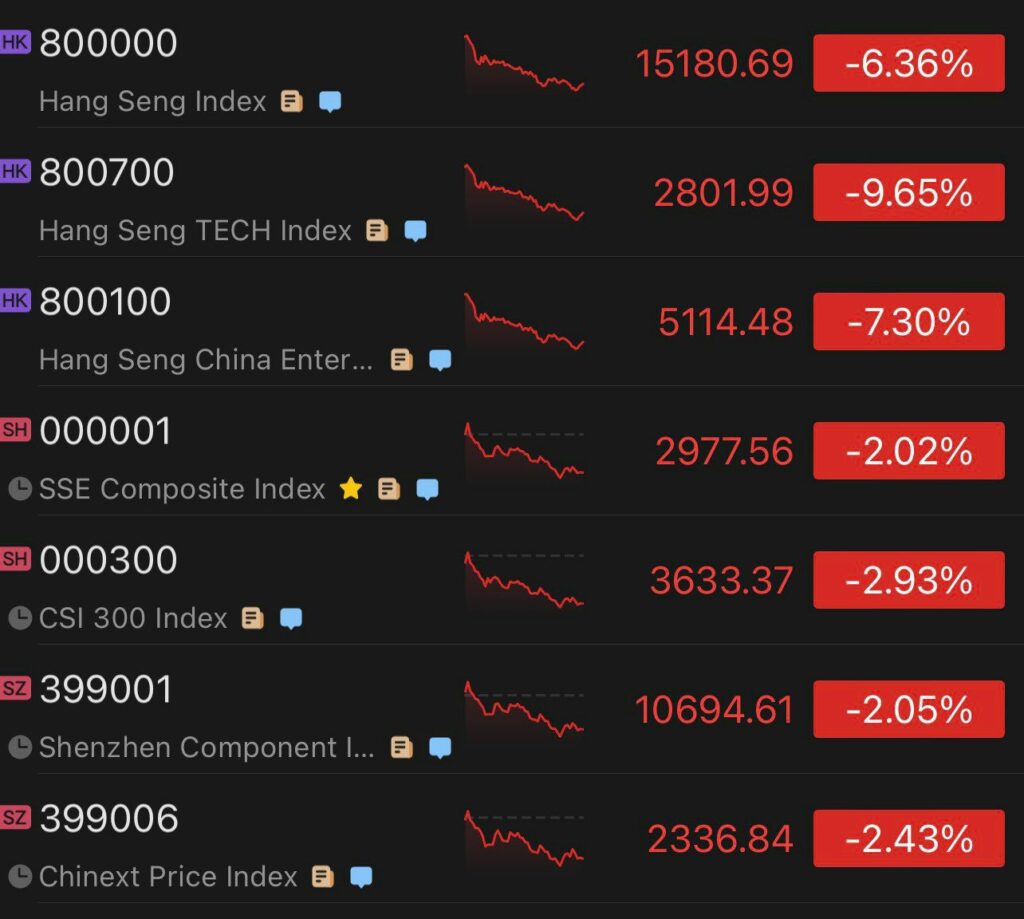
The leading western stock market index S&P 500, has strengthened by 3,74 percent on a weekly basis, while its Asian counterpart Hang Seng weakened by a whopping -10,34 percent. These figures show the growing divergence between North American and Asian markets. Gold has remained almost flat, rising only 0,12 within seven days. The decentralized finance platform Ethereum is up over 10 percent since last week, greatly decoupling from the other digital assets. Otherwise, the digital asset market seems rather dispersed, and DeFi-related tokens haven’t gained organic momentum yet.
7-Day Price Performance
Ethereum (ETH): 13,1%
Litecoin (LTC): 8,7%
Aave (AAVE): -0,2%
Chainlink (LINK): -0,0%
Uniswap (UNI): 1,2%
Stellar (XLM): -0,2%
XRP: -1,8%
S&P 500 Index: 3,74%
Gold: 0,12%
– – – – – – – – – –
Bitcoin RSI: 50
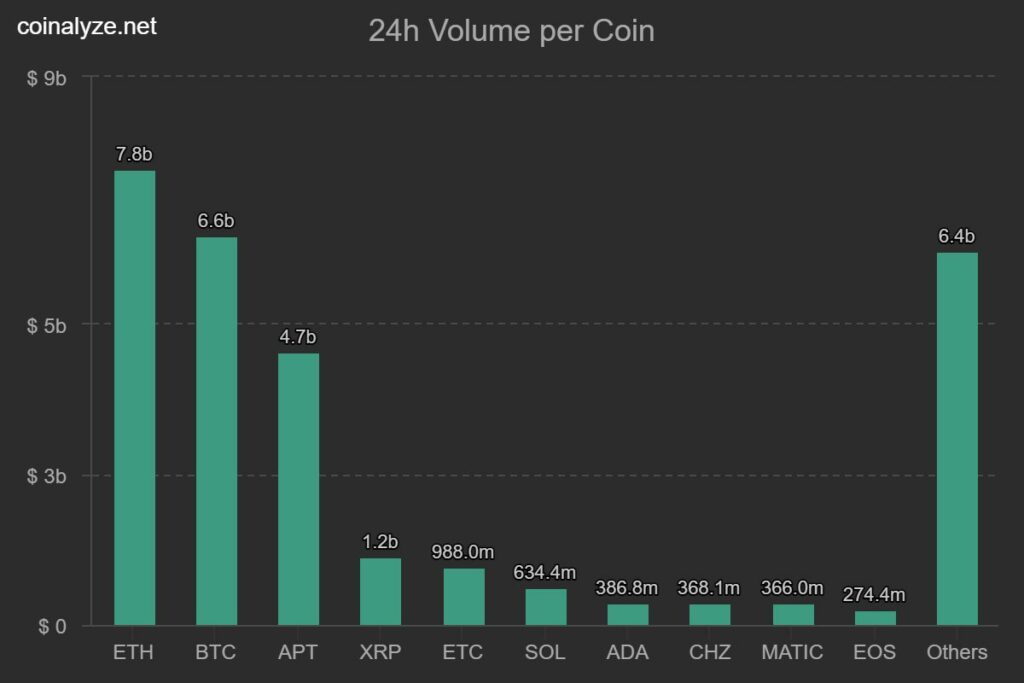
In 24h volume terms, bitcoin ($6,6B) is currently squeezed between Ethereum ($7,8B) and Aptos ($4,7B). The launch of the APT currency took place in a dramatic way last week when an unclear airdrop arrangement was suspected of distributing tokens unevenly.
In the first hours of the Aptos chain history, an unknown user placed a market sell worth 189 568 APT tokens on the Binance exchange. As a result, APT/USD dropped from $15 to $13 in a flash crash. Since then, the spot price has fallen further and weakened to the current level of around $9. Aptos was heavily shorted on the day of the launch, and the shorts represented an estimated 9 percent of the supply in circulation. APT/USD has weakened by more than -40 percent since the release date.
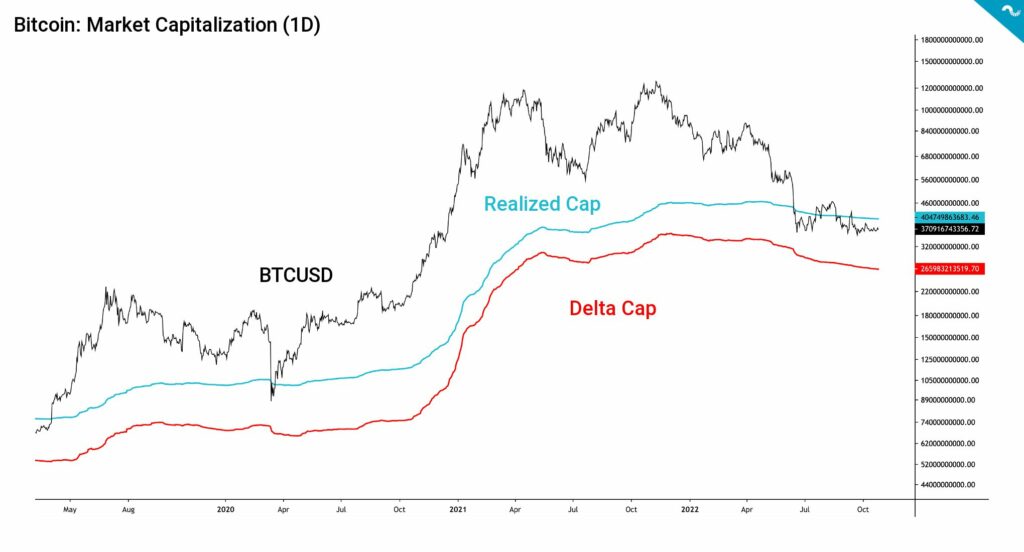
Bitcoin Between Realized and Delta Cap
Bitcoin’s market capitalization (black) dropped below the realized cap (turquoise) in the spring’s market correction and has stayed there despite momentarily inching higher in July. Bitcoin’s market capitalization is calculated by multiplying bitcoin’s supply with the USD spot price. Realized cap, on the other hand, is the sum of each UTXO multiplied by the last movement price. Delta cap (red) is calculated as the subtraction of the formerly mentioned realized cap and average cap. The red delta cap effectively mirrors bitcoin’s ultimate correction scenario.
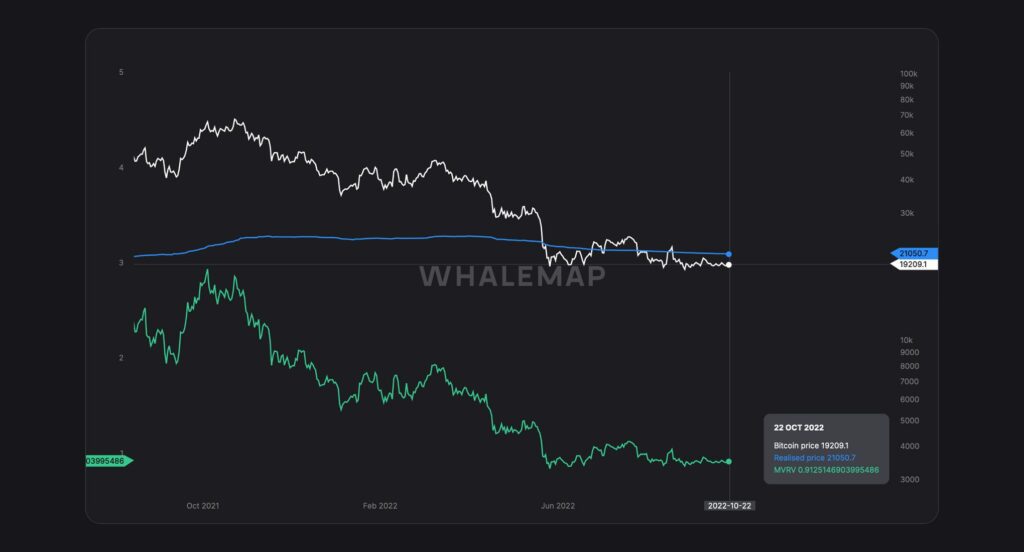
Bitcoin’s spot price and realized price mimic the relationship between bitcoin’s market capitalization and realized cap. BTCUSD is still well below the realized price (blue), and crossing the realized price would be a significant bullish signal. Bitcoin’s market value to realized value indicator MVRV (green) shows bitcoin still being deep in the DCA zone.
Have The Miners Capitulated Already?
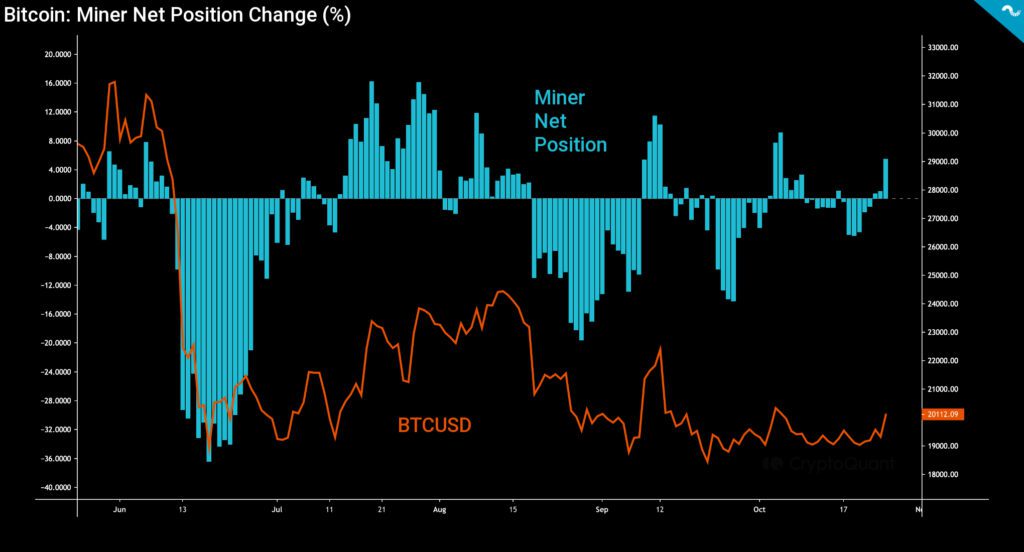
Bitcoin’s miner net position data (turquoise) offers an interesting angle toward the market, as it shows how miners have recently increased their positions by 4 percent. This could indicate that miners are seeing a possible recovery in bitcoin’s spot market and thus want to get more exposure. The miner net position shifts have deeply correlated with bitcoin’s spot price volatility, and in June’s correction, the miner net position change percentage reached -47%.
More recently, the miners increased their net positions during July’s short bull cycle and again reduced their exposure aligned with August’s sell-off. If miners now continue to increase their positions, that could signal the spot price bouncing on steady ground.
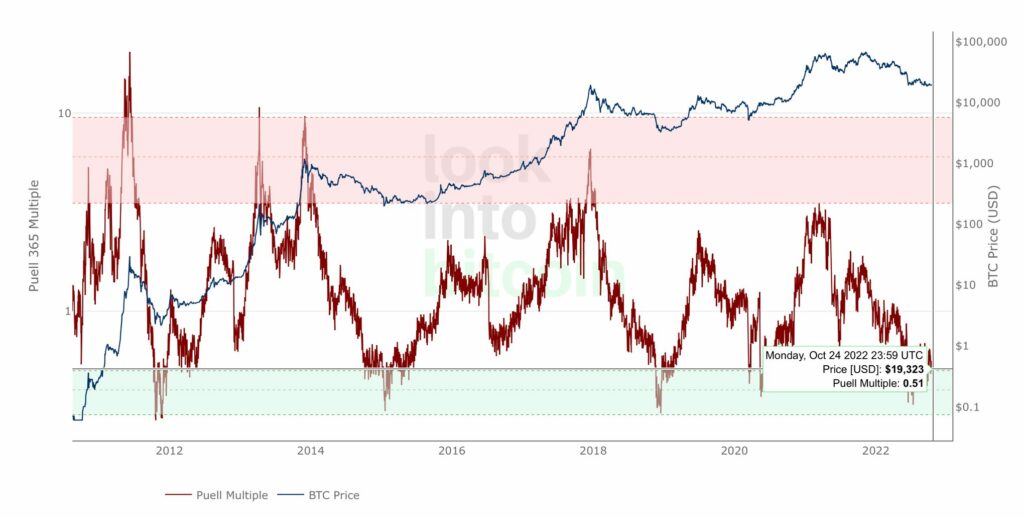
Puell Multiple is an essential indicator that focuses on Bitcoin’s supply and mirrors the profitability of PoW mining. As we know, miners need to sell native bitcoin units in order to keep their operation running, and the Puell Multiple revolves around mining revenue generation.
The Puell Multiple (PM) is calculated by dividing the daily issued bitcoins (in USD) by the 365D daily unit issuance moving average (MA). This gives us an indicator we’re usually benchmarking against the bitcoin spot price BTCUSD. As a summary, the Puell Multiple pulls mining data and compares mining profitability now (per day) against over the whole year (365 MA).
The Puell Multiple can be used to form buy and sell zones in the following manner:
Buy zone: Puell Multiple between 0 and 0,5
Sell zone: Puell Multiple between 4 and 10
The recent Puell Multiple data clearly shows how PM plunged into the green zone in the early summer sell-off, in which the indicator reached a value of 0,34. The Puell Multiple climbed to the 0,5-0,6 range in August’s buying pressure but weakened again in September. Currently, the PM is right at the edge of the buy zone, consolidating at 0,51.
What Are We Following Right Now?
Weekly crypto market wrap-up by Mark Yusko and Michael Ippolito.

Nic Carter and Peter McCormack discuss the White House bitcoin mining research paper, regulation, and the role of renewables in the energy mix.

Nomi Prins, financial analyst and the best-selling author believes the central bank Fed will pivot back to QE in 2023.

Global property prices seem to be hugely inflated, and some analysts believe we’re still in a significant real estate bubble.
Gain knowledge and read our weekly insights
- Crypto bank Nuri shuts down – here’s how to withdraw funds to Coinmotion
- Crypto adaption moving further as Google accepts cloud payments in crypto
- Binance blockchain hacked for $570 million & Swiss McDonald’s accepts Bitcoin
- Europe becoming more crypto-friendly & NFT sales are declining

The views, thoughts, and opinions expressed in the text belong to the author and not necessarily to the author’s employer, organization, committee, or other group or individual.