The technical analysis of week 46 breaks down Gareth Soloway’s market insights and the latest technical indicators. We also evaluate UTXO data, short positions, and Fed’s upcoming FOMC meeting.
Gareth Soloway Sees The Market Bottom Closing in
The market sentiment across digital assets has remained bearish over the past seven days, leading bitcoin’s spot price to slide toward the $16K zone. The selling pressure that originally started with the collapse of the FTX exchange has weakened bitcoin by -22,9 percent over the past two weeks. However, well-known analysts such as Gareth Soloway see selling pressure waning and bitcoin’s final market base at the $10K level. In the midst of everything, it’s good to remember that in 2013, the fallen Mt. Gox exchange accounted for 70 percent of bitcoin’s transaction volume, while FTX’s share of this year’s volume has only been approximately 10%.
Soloway has a history of successfully predicting the price movements of bitcoin, and he estimated that the spot price will fold down in November 2021. Since then, Soloway has predicted a long bear market for bitcoin, which is now reaching its eventual saturation point. Soloway is a well-known contrarian investor, and his main motto is: “I love undervalued investments when others hate them.”
“The key for me is that this is the beginning of the final move to the downside.“
– Gareth Soloway
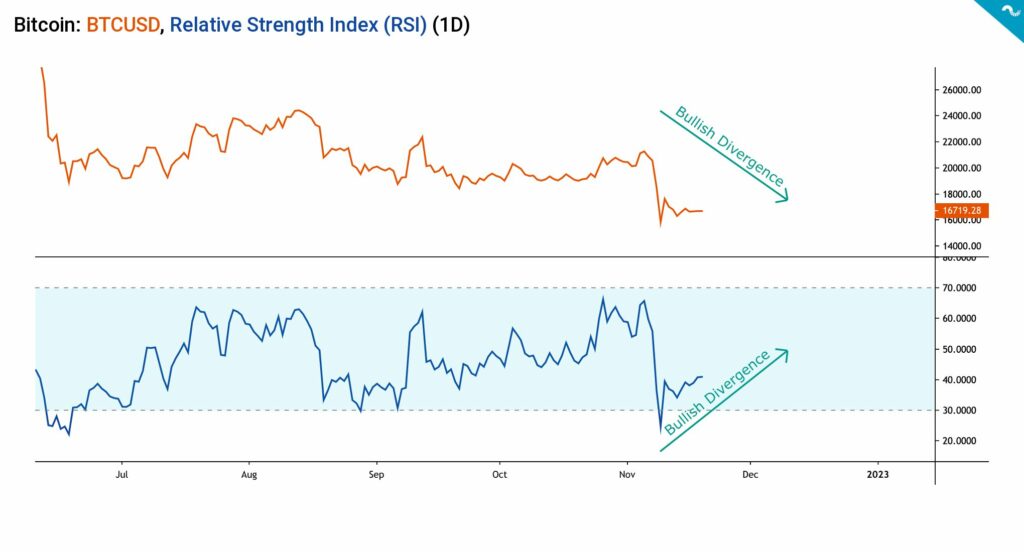
On a technical level, bitcoin is now forming a bullish divergence setup, where the spot price (orange) and the relative strength index RSI (blue) are approaching each other (graph below). This bullish divergence would predict a recovery in the spot price under normal conditions.
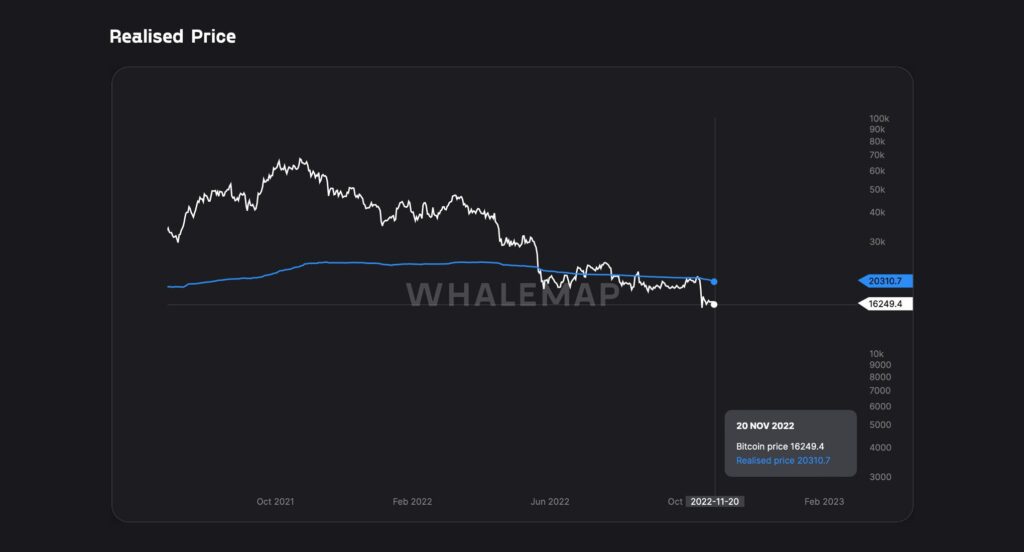
Whalemap’s data (graph below) shows how the spot price of bitcoin (white) has fallen significantly below the realized price (blue). Below the realized price, bitcoin has generally offered investors considerable buying opportunities.
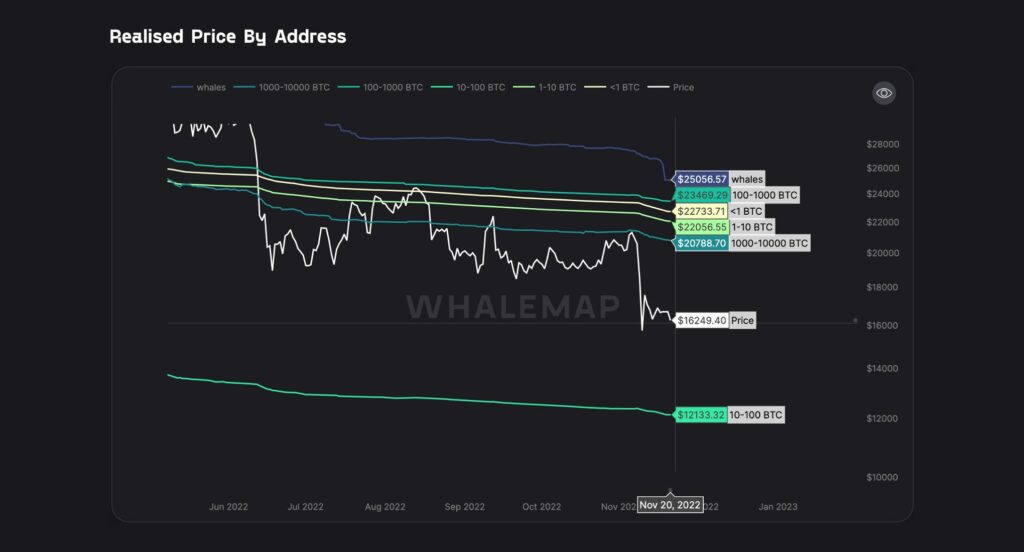
Whalemap’s data also indicates that the next support level for the spot price may be significantly lower, around the $12K level. At these lower valuation levels lies the realized price of addresses containing 10-100 bitcoin units, which serves as a target price in a negative scenario.
In a week, the percentage drop of bitcoin has only been -1,3%, however, in two weeks, the negative spot price continuum has fallen by almost -23 percent. Ethereum has weakened considerably more than bitcoin, falling -7,7 percent weekly and nearly -30 percent in two weeks. Ethereum’s prospects are dampened by the alleged “FTX hacker’s” ether holdings that have been dumped throughout the week. Surprisingly, litecoin has managed to find a 5% gain in a week, even though it has fallen -11% in a two-week time window. The leading stock index S&P 500, has fallen slightly since last week, and gold is down about -1,2 percent.
7-day Price Performance
Bitcoin (BTC): -1,3%
Ethereum (ETH): -7,7%
Litecoin (LTC): 5,3%
Aave (AAVE): -0,2%
Chainlink (LINK): -5,1%
Uniswap (UNI): -8%
Stellar (XLM): -1,8%
XRP: 3,7%
Get started with Bitcoin Litecoin Ethereum AAVE USDC Stellar Ripple
Join Coinmotion and buy your first cryptocurrencies within minutes!
S&P 500 Index: -0,7%
Gold: -1,2%
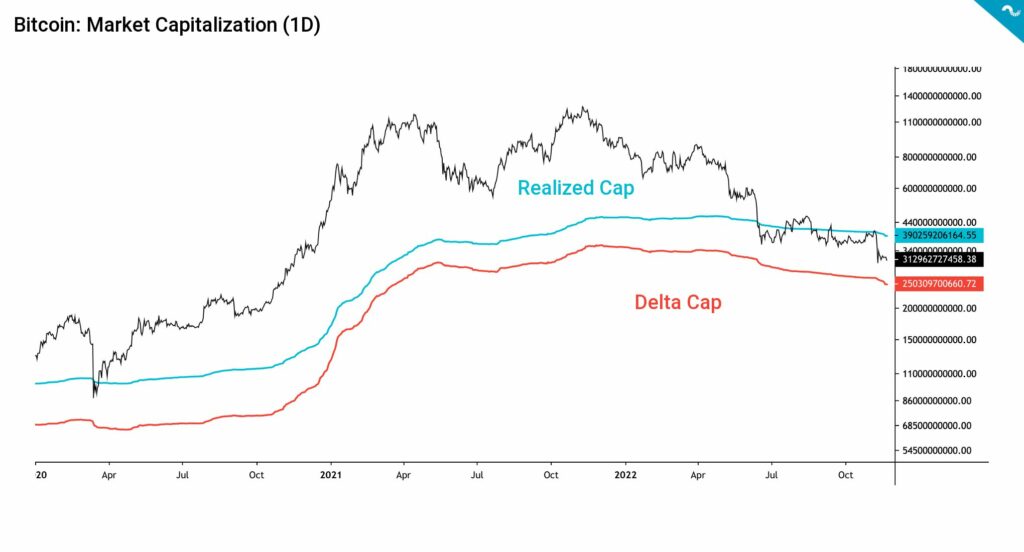
Bitcoin’s market value (black) has fallen well below the realized value (turquoise) and is taking support from the delta cap level at $250 billion. Bitcoin’s current market cap is around $310 billion.
A Record Number of Short Positions
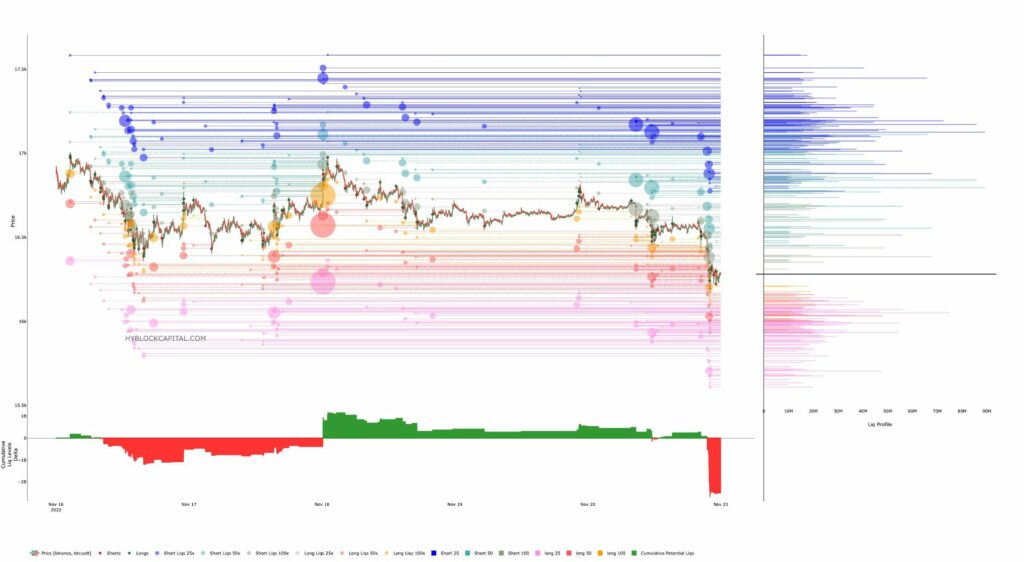
The crisis state of the crypto market has attracted a considerable number of short sellers. According to data from Hyblockcapital, bitcoin short positions have recently crossed the $2,5 billion mark.
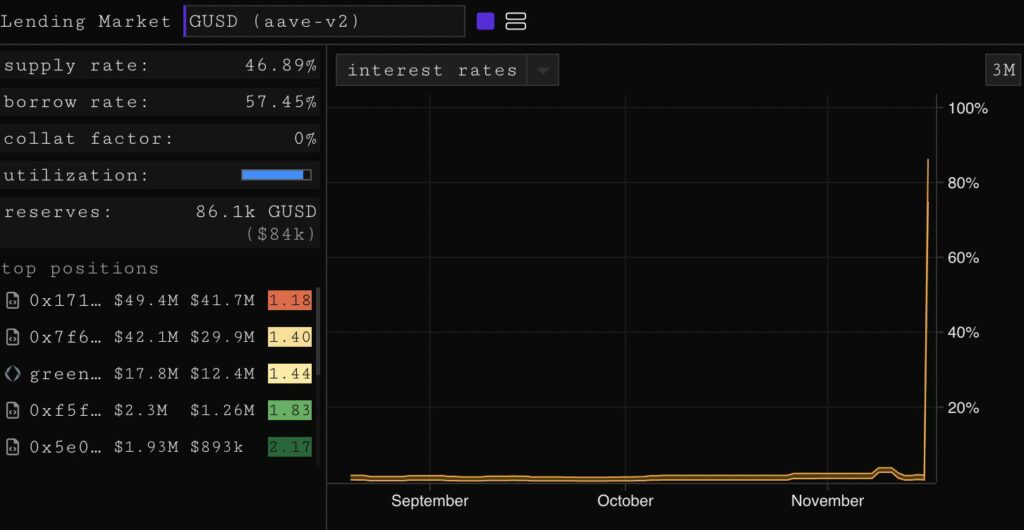
Gemini, the exchange founded by the Winklevoss twins, limited the withdrawal of its customer funds last week. The freezing of funds caused uncertainty in the markets as investors tried to repatriate their assets. Uncertainty even spread to the Gemini dollar (or GUSD) stablecoin, whose short positions have grown significantly.
UTXO Data Mirrors The Market-Wide Uncertainty
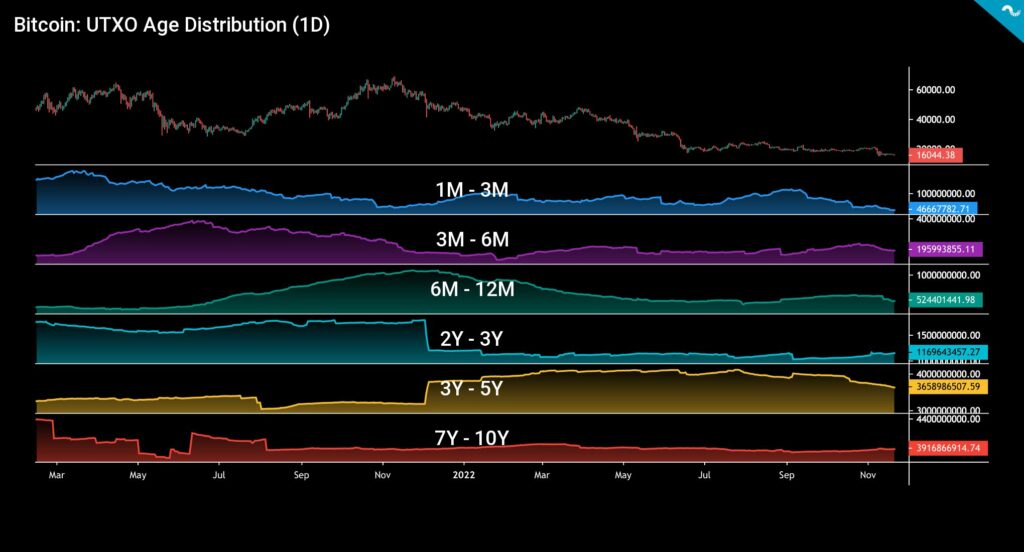
Bitcoin was originally built by Satoshi Nakamoto as a transparent system. This built-in transparency allows deep exploration of the Bitcoin system through UTXO analysis. The age distribution of UTXOs, also called HODL waves, provides a macro-level perspective on the functions of the entire Bitcoin network. HODL waves can be effectively studied by dividing them into six segments, whose development direction can be evaluated as follows:
1M-3M: Selling pressure
3M-6M: Moderate selling pressure
6M-12M: Selling pressure
2Y-3Y: Moderate accumulation
3Y-5Y: Selling pressure
7Y-10Y: Long time horizon holding
Recent UTXO data supports the general perception of long-term investors relative to short-term traders. The 7Y-10Y wave (red) has been moving sideways for years, depicting long-term investors’ dedication to the asset class. These very long-term holders are the fundamental support of the bitcoin network, and they do not generate selling pressure even if the volatility increases significantly. The 3Y-5Y wave, on the other hand, turned around during 2022, ending in a decline after a long accumulation phase. The 3Y-5Y wave represents institutions that have to sell their holdings by the multiplicative effects of the FTX saga.
Although moderate accumulation can be seen in the 2Y-3Y wave, the shorter waves are clearly on the selling side. Bitcoin assets are therefore transferred from so-called weak hands too long-time horizon holders. The recent SOPR metric also shows how short-term investors are even more under the surface, as the new paradigm is aligned with long-term strategies. The Bitcoin market favors low time preference, and spot price swings have always been a part of the asset.
Focus on The December FOMC
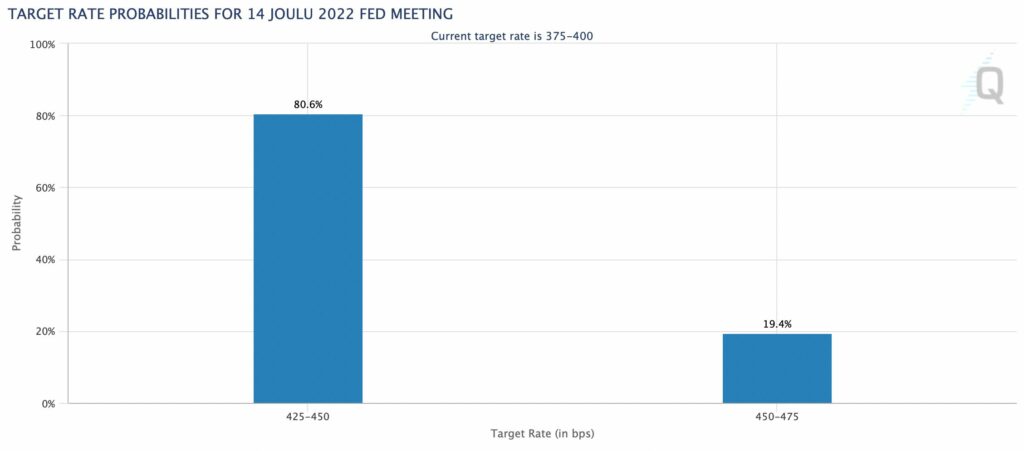
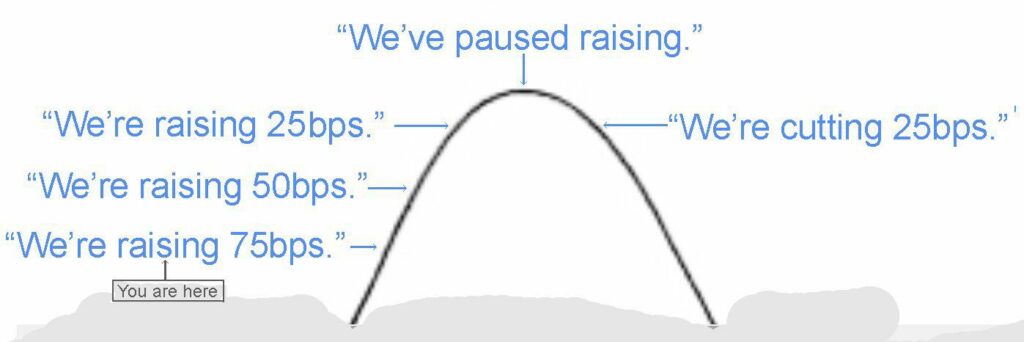
Fed’s next FOMC meeting will take place in only 23 days, and the open market committee will then meet for the last time in 2022. The Fed’s interest rate policy has been exceptionally hawkish. However, in November’s FOMC meeting Fed stated that it will take into account the tightening of monetary policy, the lags in the effect of monetary policy, and the economic picture when deciding on future interest rate hikes. These comments were interpreted as a possible slowdown in future rate hikes. CME’s data reinforces investors’ perception of a slowdown in rate hikes, while the probability of a 50 basis point rate hike is estimated to be more than 80 percent. Correspondingly, the probability of an interest rate increase of 75 basis points is only 19,4%.
The market has been waiting for a possible pivot by the Fed, which would mean the hawkish monetary policy turning to dovish. According to the chart below, subsiding inflation gives central banks the opportunity to gradually ease interest rate policy, but we’ll have to wait for the paradigm shift until 2023. The stock market has performed well in recent weeks, gaining new momentum from the reversal of the dollar index DXY. The Fed’s upcoming pivot, combined with the folding dollar index, creates a promising environment for high-beta risk asset classes, including Bitcoin and other digital assets.
What Are We Following Right Now?
Analyst and trader Gareth Soloway opens up his thoughts on the FTX crisis and the market in general. As a contrarian investor, Soloway sees bitcoin’s market base as close and the valuation level as favorable.
Mark Yusko and Michael Ippolito break down the week’s events and the potentially widening liquidity crisis of centralized crypto platforms.
Crypto Megan and David Lin discuss the FTX crisis and market sentiment in the aftermath.
Learn from our previous TA’s
- Technical Analysis: The Black Swan
- Technical Analysis: A Speculative Attack on FTX Exchange
- Technical Analysis: Is Altseason a Possibility?
The views, thoughts, and opinions expressed in the text belong to the author and not necessarily to the author’s employer, organization, committee, or other group or individual.
Get started with Bitcoin Litecoin Ethereum AAVE USDC Stellar Ripple
Join Coinmotion and buy your first cryptocurrencies within minutes!
