

Technical analysis of week 52 evaluates bitcoin’s technical setting and the possibility of an early-year relief rally. In addition, we analyze MicroStrategy’s newest bitcoin purchases and UTXO age distribution data.
An Elevated Chance for a Relief Rally
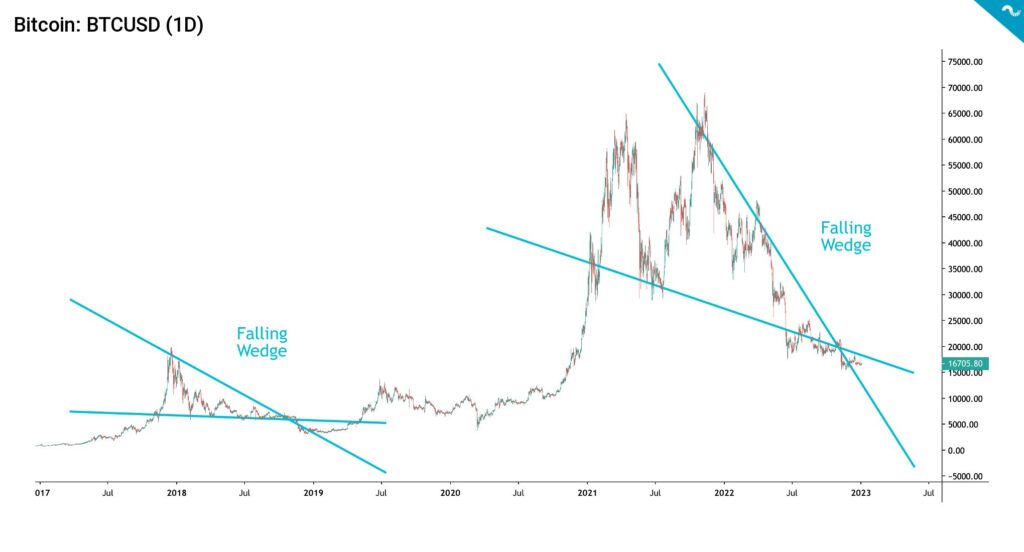
The price development of the crypto market has continued in a sideways motion since last week, with the leading cryptocurrency, bitcoin, weakening by a modest -1 percent. From a technical perspective, bitcoin is still following its multi-year falling wedge (turquoise), which resembles the falling wedge of 2017-2019. A technical falling wedge is considered a positive indicator by default, and the spot price’s escape from the wedge would mean a market reversal.
Despite everything, the market also offers positive signals. Michael Saylor announced last week that MicroStrategy (MSTR) acquired 2500 new bitcoin native units, bringing its balance to 132 500 bitcoins. MicroStrategy’s bitcoin holdings are now worth around $2,2 billion and were acquired at an average price of $30 397. The scale of the company’s bitcoin holdings is illustrated by the fact that MSTR owns one out of every 159 bitcoins in circulation.
Michael Burry, known for his Scion Capital fund, estimated on Monday (2.1) that CPI inflation has reached its peak level of the current cycle. According to Burry, inflation will decrease, even leading to negative CPI readings during the second half (H2) of 2023. Burry predicts that the Fed will start cutting interest rates, and he also sees a return to quantitative easing (QE). According to him, the stimulus cycle will again lead to a new rise in inflation in the long term. Changing the Fed’s hawkish stance to dovish would give high-beta investments room to maneuver again.
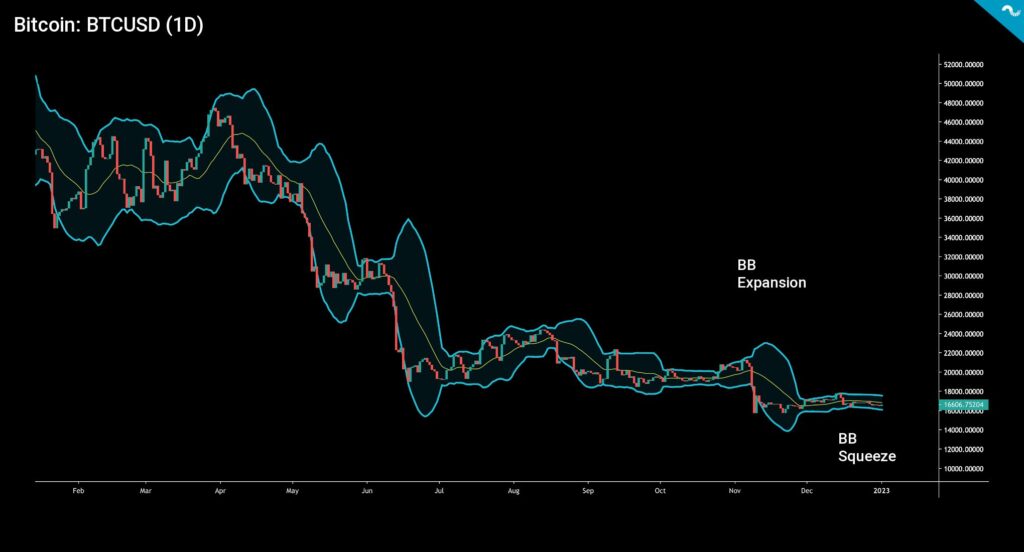
The Bollinger bands (turquoise) are once again squeezing bitcoin’s technical setup, leading to a possible bounce up. The possibility of a relief rally increases during the first weeks of 2023.
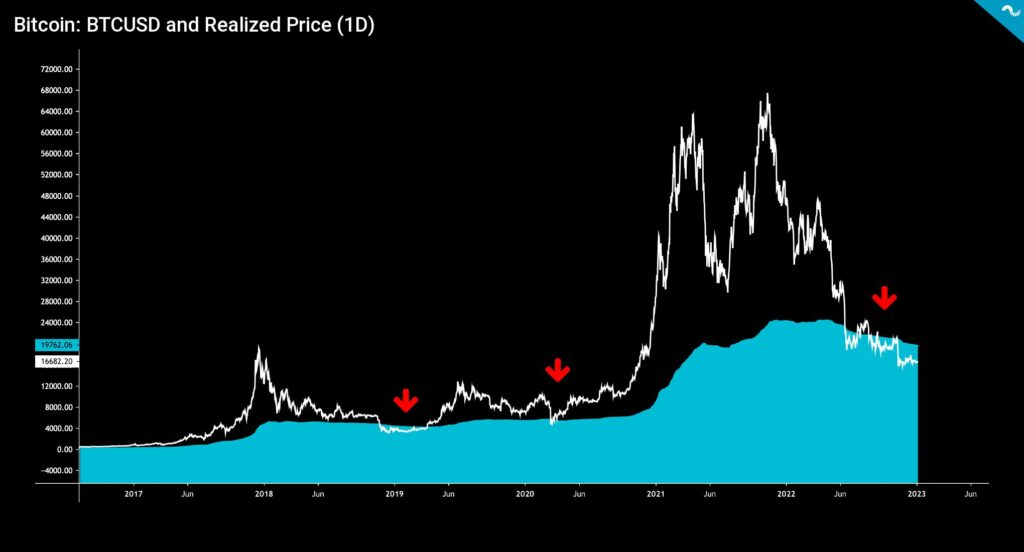
The spot price of Bitcoin has fallen below the realized price (turquoise) since mid-June. If we don’t take the local increases above the realized price into account, the spot has been oversold for more than six months now. From the point of view of the realized price, the current bear cycle has already exceeded the 2018-2019 bear market in length, where the spot price fell below the realized price for 133 days. The realized price acts as a support level for the spot price, with bitcoin strongly undervalued, but in the current bear scenario, the realized price has become a resistance level.
The price development of the market has continued sideways since last week, with bitcoin and ethereum weakening by around one percent. Characterized as bitcoin’s “testnet,” litecoin has gained nearly seven percent in a week as investors await next year’s halving event. According to the NiceHash company, the estimated date of litecoin’s halving is August 3, 2023. The price development of higher beta DeFi tokens is looking for a direction, with quotations spread on both sides of zero. The S&P 500 index weakened in the week by -0,1 percent, and gold strengthened by 1,3%.
7-Day Price Performance
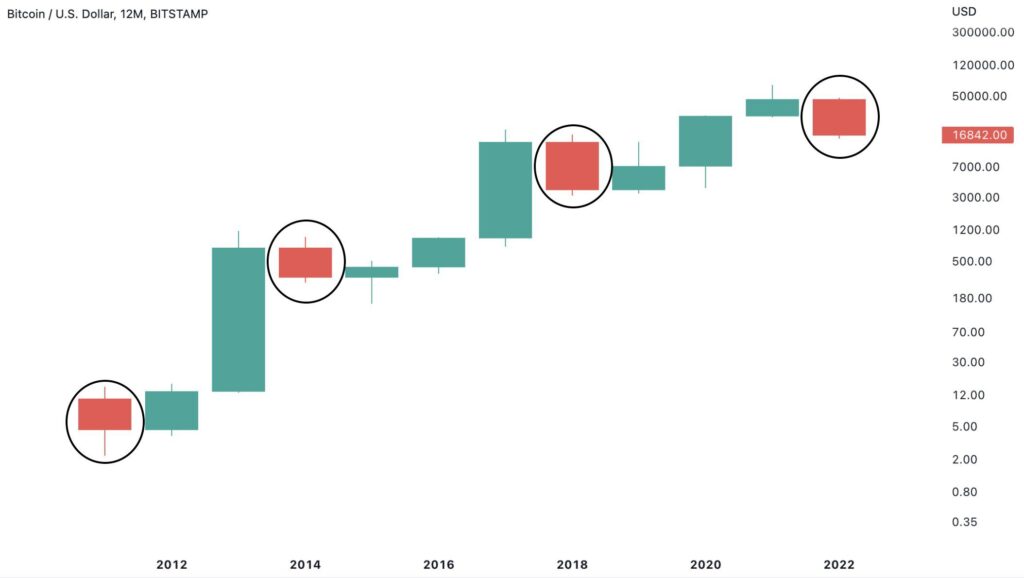
In Bitcoin’s Price History, a Red Yearly Candle Has Always Been Followed by a Green One
Despite the bear market, 2023 can be assumed to be more positive than this year. Bitcoin’s prospects for 2023 are especially supported by the fact that the asset class’s price history does not know two consecutive yearly red candles. In the sequence of Bitcoin’s yearly candles, red has always been followed by green.
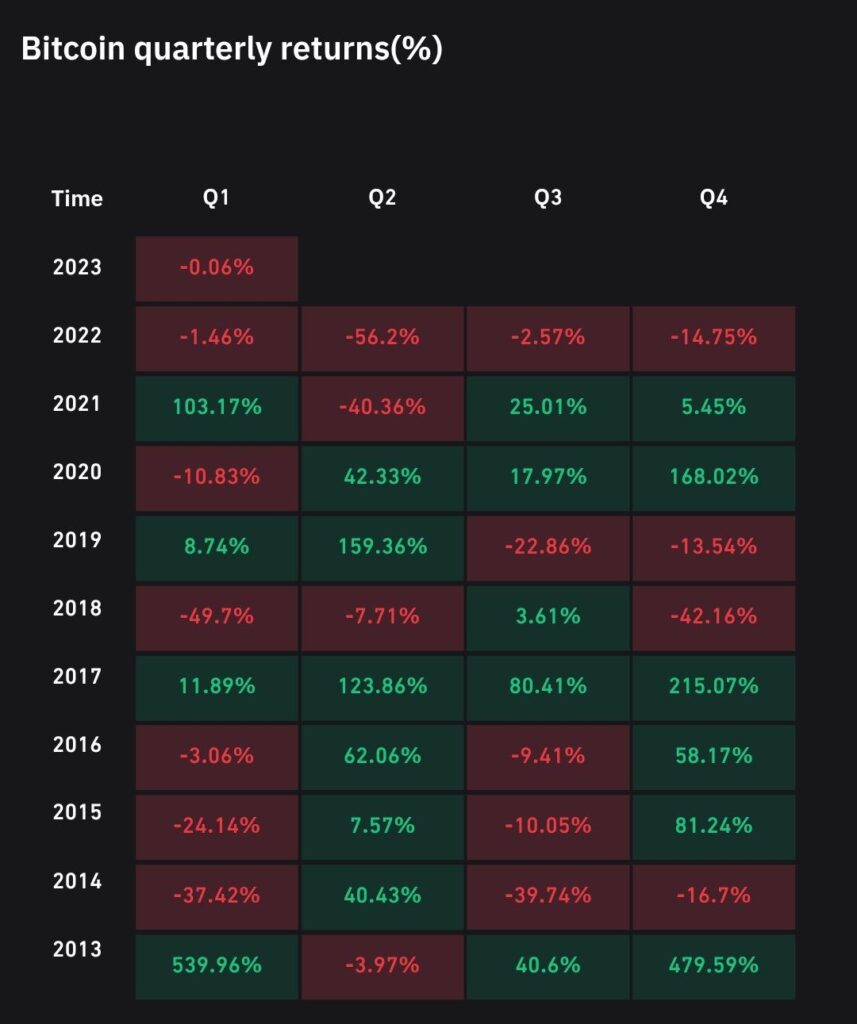
On a quarterly basis, bitcoin’s price performance was remarkably brutal in 2022. The chart below shows how the spot price of bitcoin fell in each quarter, weakening the most during Q2 (-56,2%). Bitcoin history does not know another year in which the spot price has weakened every quarter. During the bear cycles in 2014 and 2018, the spot price weakened in three quarters.
MicroStrategy as a Leading Indicator?
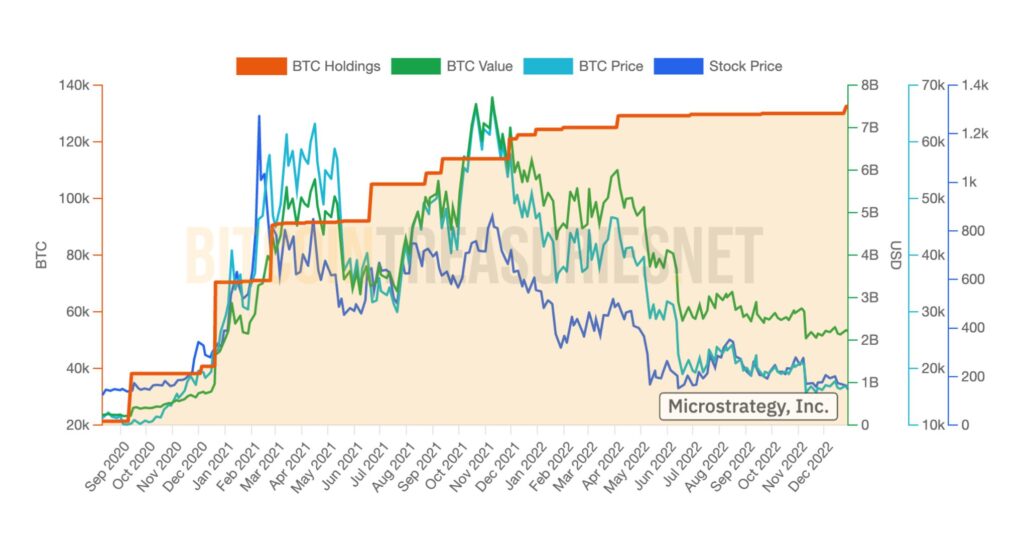
Michael Saylor announced last week that MicroStrategy (MSTR) acquired 2500 new native bitcoin units, bringing its balance to 132 500 coins. MicroStrategy’s bitcoin holdings are now worth around $2,2 billion and were acquired at an average price of $30 397. The stock price of MicroStrategy (MSTR) was closely correlated with the bitcoin spot price in the second half of 2020, but the correlation weakened in 2021. When the bitcoin’s spot price reached its second peak in the 2021 double-peak structure, MSTR no longer followed the same correlation. Later, since the summer of 2022, the correlation between MSTR and BTC has increased again.
Michael Saylor and MicroStrategy, which he founded in 1989, have profiled themselves as pioneers of institutional bitcoin investing. The company’s turning point occurred in July 2020, when Saylor announced that it would replace the company’s dollar holdings with bitcoins and alternative assets. Saylor is also known for his bitcoin theses, which include defensive, opportunistic, and strategic arguments.
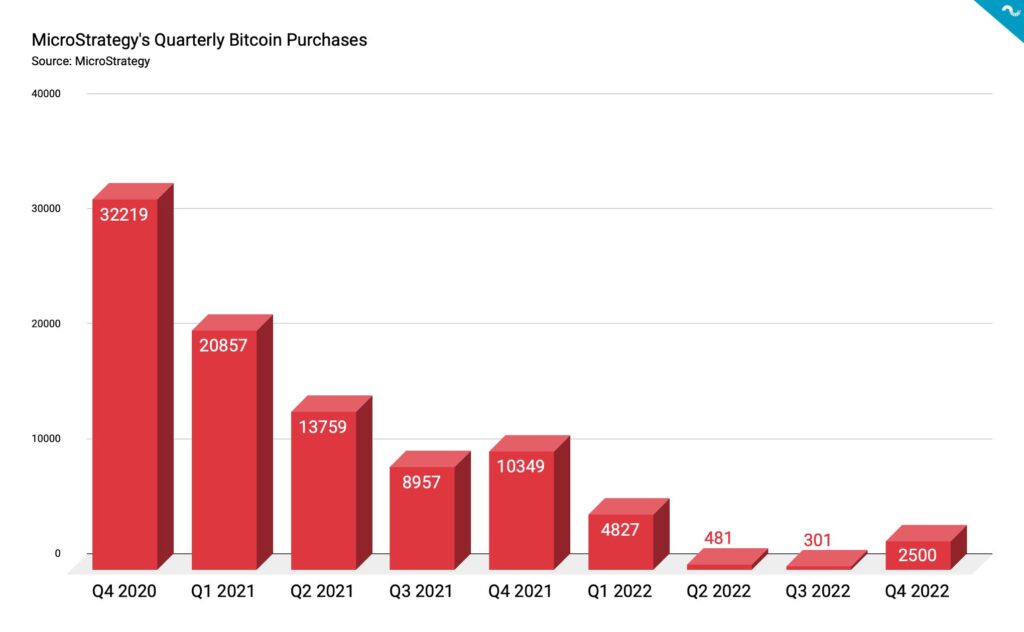
Coinmotion Research gathered MicroStrategy’s quarterly purchases into one chart that mirrors the accumulation in 2020-2022. MicroStrategy’s most active quarter in bitcoin purchases was Q4 2020, during which MSTR acquired a total of 32 219 bitcoin units. During the following first quarter of 2021, MicroStrategy brought 20 857 bitcoins to its balance sheet. MSTR’s bitcoin purchases remained high in 2021, with the company acquiring more than 10 000 bitcoins in quarters two and four.
The chart can be interpreted from many points of view, but in terms of price development, it can also be seen as a leading indicator. In the first quarter of last year, the company’s bitcoin purchases peaked at 4827 units but fell sharply during quarters two and three. In the fourth quarter of last year, however, bitcoin purchases recovered to 2500 units. Since MicroStrategy has been seen as an indicator of institutional appetite, could the increase in buying volume in the fourth quarter be indicative of a broader recovery in the market? Companies like MicroStrategy are the first to increase their exposure to bitcoin as we approach the market bottom.
UTXO Data Indicates Increasing Capitulation
When Satoshi Nakamoto created Bitcoin, he made a structure that required a significant amount of work (PoW). The Bitcoin blockchain is also transparent, allowing us to examine the active supply and UTXO data. The research firm Delphi Digital research company successfully predicted a market capitulation of early 2019 using the UTXO data. The current UTXO distribution resembles the situation in 2019, but the final capitulation may occur after the market cap falls below the delta cap level. Undercutting the delta cap would mean a further -30 percent price correction for bitcoin.
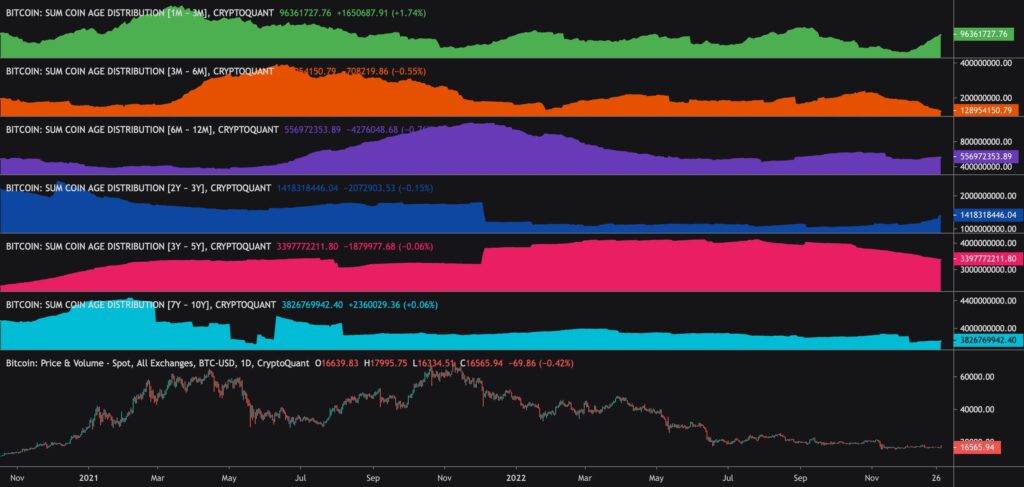
While the retail-based 1M-3M wave (green) reflects positive sentiment, longer periods such as 3Y-5Y (red) show investors reducing risk. Short-term traders’ wave 3M-6M (orange) continues to suffer big losses. However, at the institutional level 2Y-3Y (deep blue), there are signs of moderate accumulation.
1M-3M (green): Accumulation
3M-6M (orange): Selling pressure
6M-12M (violet): Moderate accumulation
2Y-3Y (deep blue): Moderate accumulation
3Y-5Y (red): De-risking
7Y-10Y (turquoise): Long-term holding
What Are We Following Right Now?
Bitcoin analyst Pierre Rochard sees the cryptocurrency likely moving from a cycle of disillusionment to a new cycle of enlightenment.
Lyn Alden opens up about her views on bitcoin and the macro market.

Mark Yusko, known for his Morgan Creek hedge fund, tells his crypto thesis for 2023. In addition, the program discusses the competition between bitcoin and ethereum, and digital central bank currencies (CBDC).

Stay in the loop of the latest crypto events
- Technical Analysis: Volatility in a Radical Decline
- Crypto exchanges’ reserves & PayPal and MetaMask cooperation
- Bitcoin’s Price Predictions for 2023
- The crypto scam landscape: What to look out for?

The views, thoughts, and opinions expressed in the text belong to the author and not necessarily to the author’s employer, organization, committee, or other group or individual.