

The technical analysis of week 51 charts the latest outlook of the market for digital assets. We also get to know Alex Sunnarborg’s cycle model, bearish volatility, and the outlook for miners.
Bitcoin’s Outlook is Dominated by a Technical Wedge
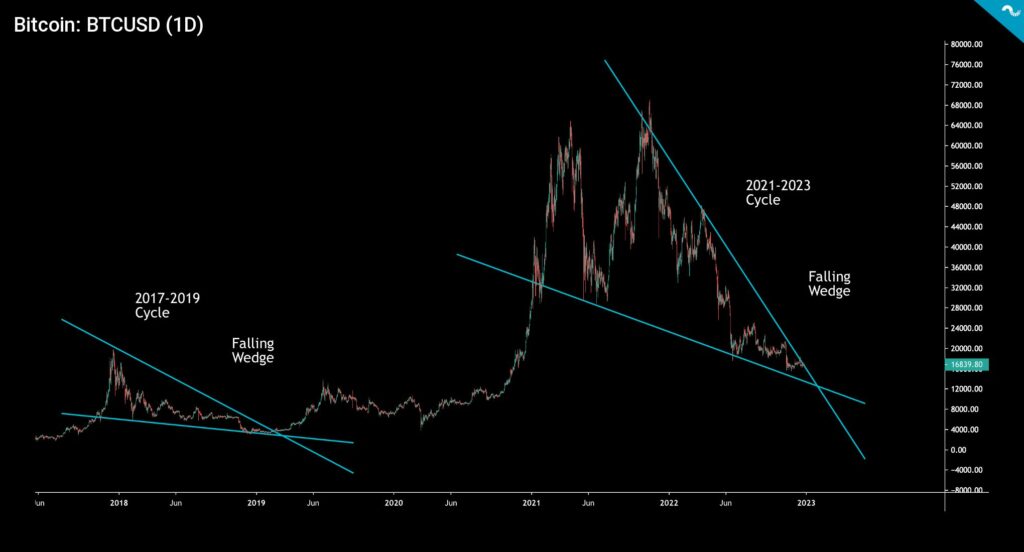
The crypto market has continued its weekly sideways motion, which has weakened the leading cryptocurrency, bitcoin, by a modest 1,2 percent. The market is clearly in a waiting state, with macro uncertainties still present. From a technical analysis perspective, the bearish wedge (turquoise) of the current bitcoin price cycle resembles the bearish wedge of 2017-2019, the tip of which indicated the market bottom of the spot price. A technical falling wedge is considered a positive indicator by default, and the spot price’s breakout from the wedge would mean a market reversal. Many analysts estimate the market bottom to be close.
Last week’s technical analysis estimated that bitcoin is in a new accumulation cycle anticipating the halving event, which will continue until 2024. The estimated date for the halving event in 2024 is March 28, so at the time of writing, it is 455 days away. Bitcoin’s next halving will happen in block 840 000 and will reduce the block reward from 6,25 to 3,125. In the previous halving cycle, the spot price of bitcoin increased by 1263 percent between 2016 and 2020. If the same trend continues, Bitcoin will reach the level of 100 000 euros in 2024.
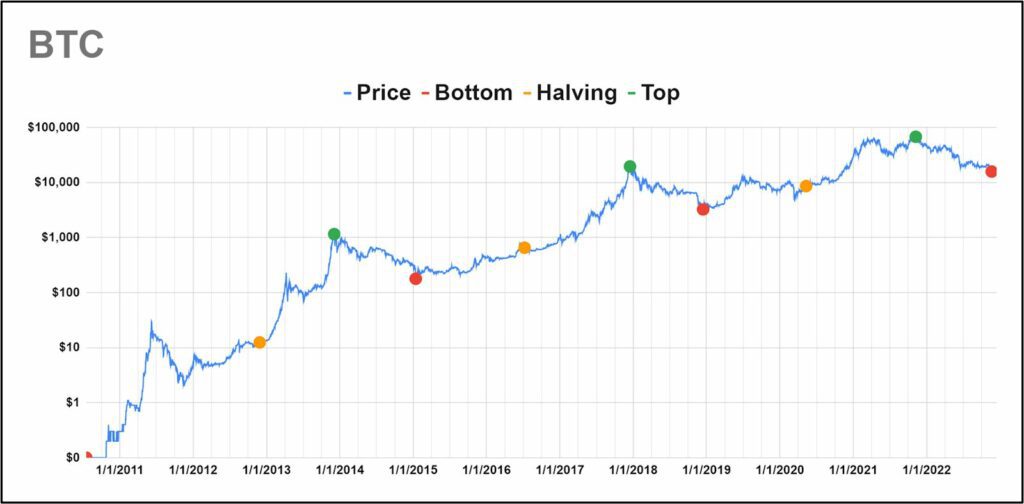
Tetras Capital’s Alex Sunnarborg sees the Bitcoin market as cyclical and the halvings that occur every four years as the fundamentals that define the market. Sunnarborg reminds us that the market has only seen three halvings and three separate halving cycles derived from them. In his model, each successive cycle can be divided into a market bottom (red), a halving (yellow), and a market peak (green). Sunnarborg points out that the spot price of bitcoin has always risen during each sequential cycle.
Alex Sunnarborg sees a lot of similarities between the 2017 and 2021 cycles. In 2017, the main driver of the market were the ICO funding rounds, which drowned the industry in new retail money. In 2018, the retail money in question fled the market, and the result was regulatory laundry. In 2021 and during the “DeFi summer” of the year before that, decentralized finance brought new momentum to the market. After parabolic rise of 2020-2021, there is yet another regulatory crackdown ahead.
Sunnarborg sees the role of institutions as still strong. In 2020, Michael Saylor profiled himself as a thought leader in “institutional bitcoin,” which prompted many tech firms to seek exposure to the asset class. Saylor’s MicroStrategy ( MSTR ) remains one of the largest institutional-grade bitcoin holders, with 130 000 native units in the balance sheet. Other notable holdings include, e.g., Mt. Gox exchange bankruptcy estate (140 000) and Grayscale’s GBTC fund (640 000).
Alex Sunnarborg reminds us that the correlation between bitcoin and the stock market is still relatively high. In the bull cycles of 2016 and 2017, and in the consequent bear market of 2018, macro correlations were much weaker. What the stock market did was relatively irrelevant. In the bull run of 2020 and 2021, and in the bear market of 2022, correlations increased significantly. Crypto rose and fell largely with the stock market. For the first time, events in the macro market not only affected crypto, but events in the crypto market also affected the macro market. When the central bank Fed moved interest rates to near zero after COVID, stocks and cryptocurrencies went on a massive bull run. The short positions were destroyed. In 2022, when the Fed moved interest rates down from zero, stocks and cryptocurrencies also turned around. The longs received severe punishment. “Don’t fight the Fed” thesis was quickly realized.
The price development of the market has continued almost sideways since last week, with bitcoin and ethereum weakening by around one percent. Higher beta DeFi tokens have weakened more than bitcoin, with the native token of the decentralized Uniswap exchange ending up with a slide of -3,7 percent. Somewhat surprisingly, XRP has been in good shape during the seven-day time window, buoyed by supportive SEC speculation. The S&P 500 index has also moved almost sideways, correlating with digital asset classes on a weekly basis. Gold weakened by a modest -0,4 percent.
7-Day Price Performance
Radically Decreasing Volatility
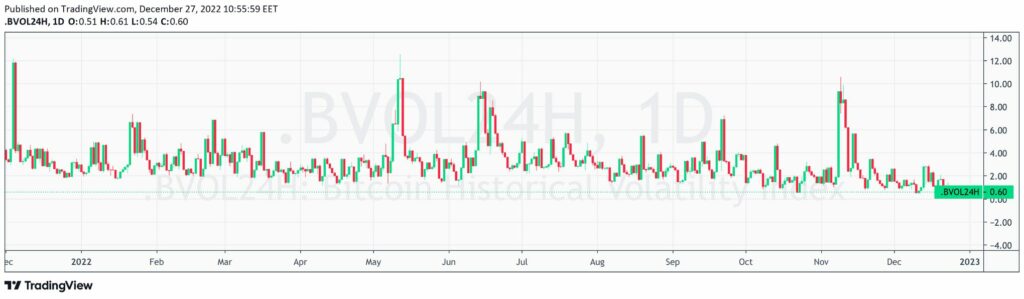
The sideways market also means a decrease in volatility. The .BVOL24H index of the BitMEX exchange has fallen to the level of 0,6, which represents the lowest reading of the year. .BVOL24H is calculated as a logarithmic percentage change, and its data points are collected from the bitcoin spot price every five minutes. Low volatility has generated price rallies in the past, a good reference of which is the period of low volatility in 2020, which led to a 600 percent increase in the spot price.
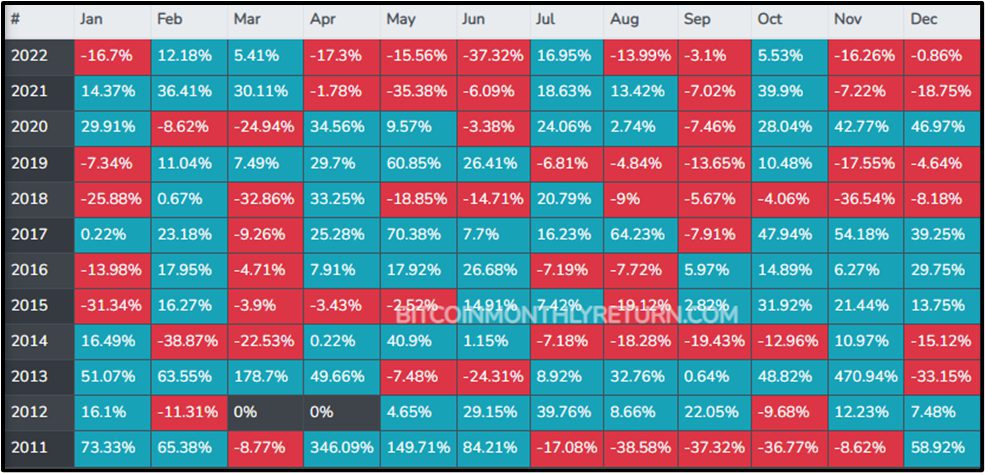
The monthly price development matrix shows that the selling pressure is calming down. The biggest price drop was seen in June when BTC/USD fell a whopping -37,32 percent. The reading is similar to November 2018, when the spot dropped -36,54%. The matrix also shows other similarities to the bear cycle in 2018, after which the bitcoin market recovered quickly. In May 2019, Bitcoin surprised the market by rising 60,85 percent after a long negative epoch.
Delta Cap and Final Capitulation
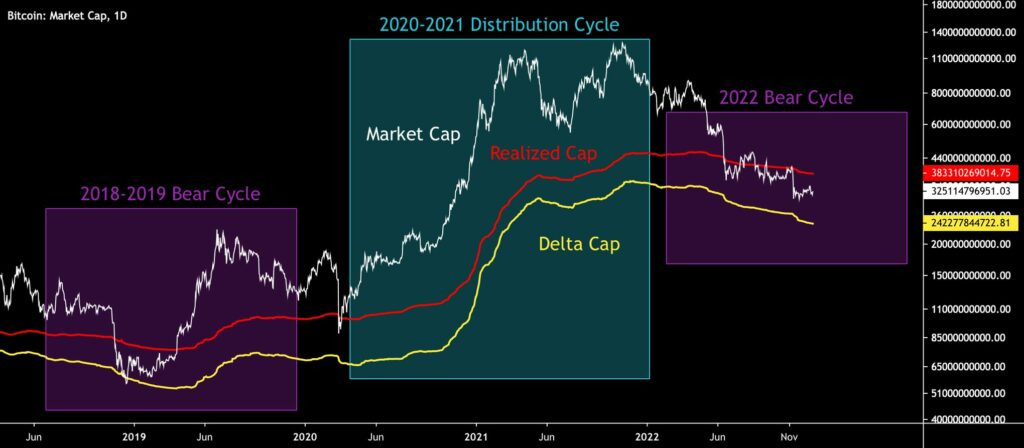
Bitcoin’s spot price continues to reflect market uncertainty, with BTC/USD oscillating between $16K and $17K. Despite everything, the market cap of bitcoin (white) is still relatively high at $322 billion. The market capitalization peaked at $1,28 trillion in early November last year.
The current 2022 bear cycle (purple, right) has now lasted more than 12 months, while capitulation is nearing. Compared to the bear cycle of 2018–2019 (purple, left), bitcoin’s market value is still between the realized cap (red) and delta cap (yellow) indicators. A special feature of the last bear cycle was the drop in market value below the delta cap, which indicated the final market base. It’s easy to argue that Bitcoin hasn’t bottomed until the market cap goes below the delta cap again.
Hashrate Indicates a Paradigm Shift
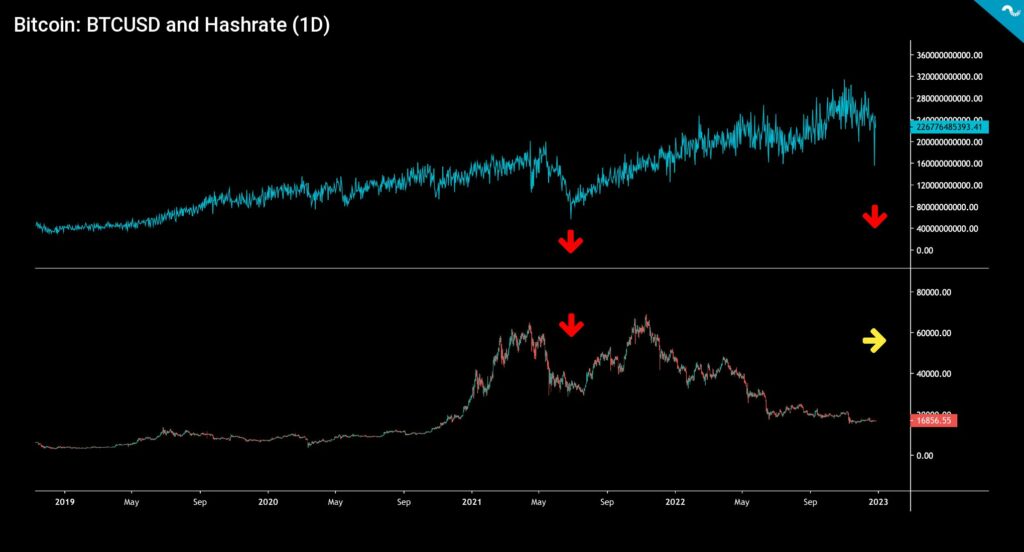
Bitcoin’s hashrate has fallen to its lowest level in 2022. Compared to 2021, the bitcoin spot price does not form a common wick bottom with the hashrate (red arrow), and it’s now moving sideways (yellow arrow). Still, compared to the peak of 2017, bitcoin is still at the same level of confluence, however the mining power has increased by 1000 percent. The mining power always describes the adaptation of bitcoin, and the spot price can be predicted to return to the same rising angle as hashpower.
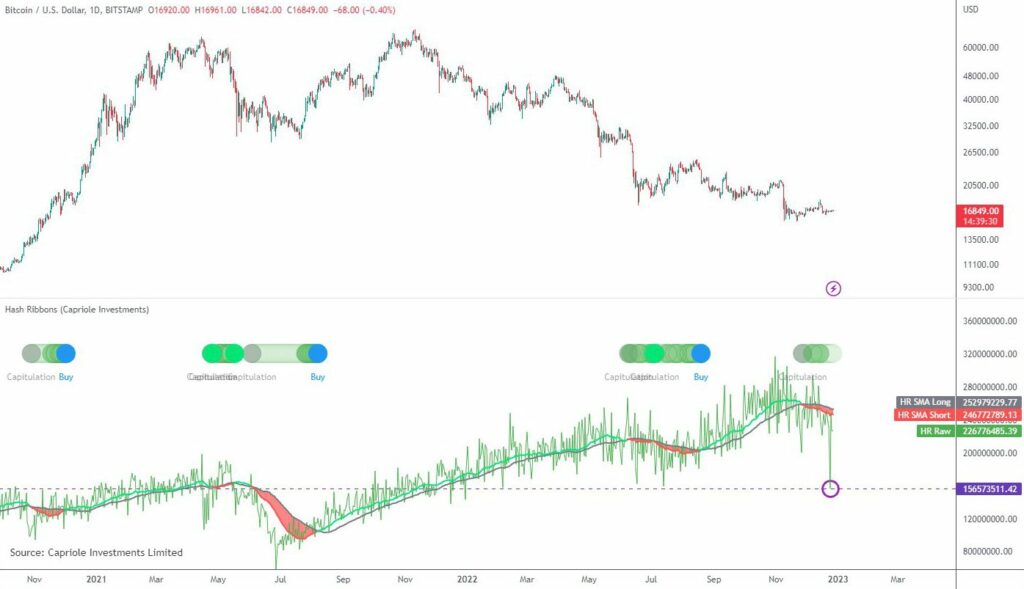
Capriole Investments sees the spot price of bitcoin as significantly undervalued. According to Capriole, the bitcoin price discount is -55 percent in relation to the “energy value,” which is calculated according to the electrical power (W) of the network. Capriole Investments has previously estimated that bitcoin’s final market bottom is close as mining companies have reached a capitulation point. The company has also pointed out that without the multiplier effects of the FTX crisis, the price of bitcoin would be closely correlated with the stock market and would currently be around the $25K level. Capriole Investments is an asset management house registered in the British Virgin Islands, whose clientele consists mainly of HNWI clients. In addition, Capriole has raised its profile in the field of on-chain market research.
What Are We Following Right Now?
Rune Summers and Lawrence Lepard, representing the Austrian school of economics, discuss the FTX crash, the November CPI, and the Fed’s seventh rate hike in 2022.

Analyst and trader Gareth Soloway sees bitcoin reaching its market bottom in 2023. Gareth also shares her views on broader market sentiment.

Nordic Law’s Jon Hautamäki opens his views on crypto regulation, future MiCA, decentralized autonomous organizations (DAO), DeFi, and the metaverse.

Stay in the loop of the latest crypto events
- Crypto exchanges’ reserves & PayPal and MetaMask cooperation
- Technical Analysis: Bitcoin’s Price Predictions for 2023
- The crypto scam landscape: What to look out for?
- The Bank of Spain confirms the registration of Coinmotion as a cryptocurrency operator

The views, thoughts, and opinions expressed in the text belong to the author and not necessarily to the author’s employer, organization, committee, or other group or individual.